Museums preserve clues that can help scientists predict and analyze future pandemics

Pamela Soltis

Distinguished Professor and Curator, Florida Museum of Natural History, University of Florida

Joseph Cook

Professor of Biology and Curator, Division of Mammals, Museum of Southwestern Biology, University of New Mexico

Richard Yanagihara

Professor of Pediatrics and Principal Investigator, Pacific Center for Emerging Infectious Diseases Research, University of Hawaii

24 June 2020  8.17am EDT

***

In less than 20 years, communities around the globe have been hit by a string of major disease outbreaks: SARS, MERS, Ebola, Zika and now, COVID-19. Nearly all emerging infectious diseases in humans originate from microorganisms that are harbored by wildlife and subsequently “jump,” either directly or indirectly – for example, through mosquitoes or ticks – to humans.

One factor driving the increase in zoonotic disease outbreaks is that human activities – including population growth, migration and consumption of wild animals – are leading to increased encounters with wildlife. At the same time, genetic mutations in viruses and other microbes are creating new opportunities for disease emergence.

But humans remain largely ignorant of our planet’s biodiversity and its natural ecosystems. Only two million species – about 20% of all the estimated species on Earth – have even been named. In our view, this fundamental ignorance of nearly all aspects of biodiversity has resulted in an inefficient, poorly coordinated and minimally science-based response to key aspects of the COVID-19 pandemic.

We have diverse backgrounds in plant and mammal evolution and emerging infectious diseases. In a newly published commentary that we wrote with colleagues from across the U.S. and in six other countries, we identify a largely untapped resource for predicting future pandemics: natural history collections in museums around the world.

These collections preserve specimens of animals, plants and other organisms that illustrate the diversity of life on Earth. They are reservoirs of information and samples that can help scientists identify likely pathogen sources, hosts and transmission pathways. We believe that leveraging collections in this way will require more resources and more collaboration between biodiversity scientists and disease outbreak sleuths.

Sir David Attenborough explains how museum collections contribute to our understanding of the natural world.

Archives of life on Earth

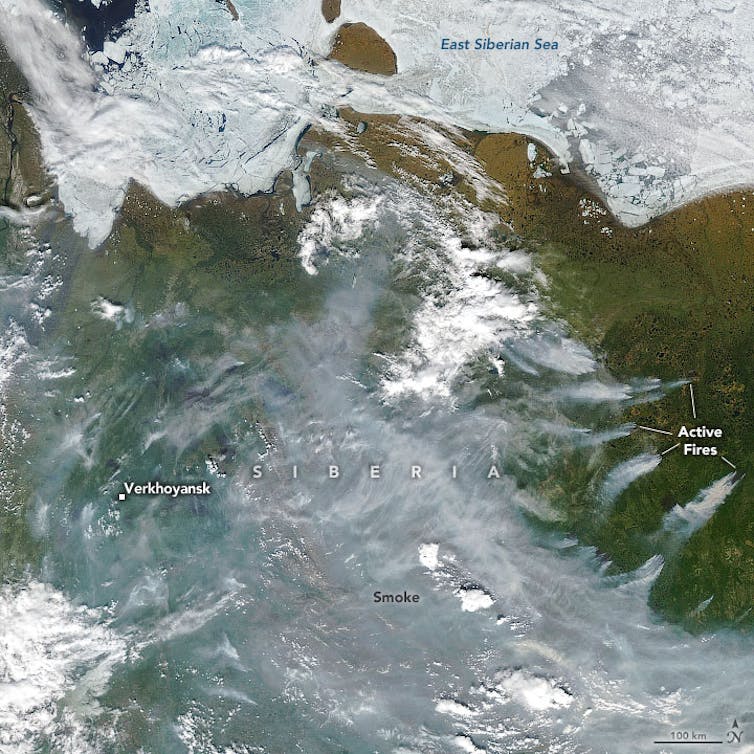
Research shows that zoonotic diseases have increased due to human intrusion into animal habitats. In particular, destruction of tropical rain forests throughout the world has brought us face to face with microbes that occur naturally in wild animals and can cause disease in our own species.

Earth’s biodiversity is connected through a family tree. Viruses, bacteria and other microbes have evolved with their hosts for millions of years. As a result, a virus that resides in a wild animal host such as a bat without causing disease can be highly pathogenic when transmitted to humans. This is the case with zoonotic diseases.

Unfortunately, national responses to disease outbreaks are often based on very limited knowledge of the basic biology, or even the identity, of the pathogen and its wild host. As scientists, we believe that harnessing centuries of biological knowledge and resources from natural history collections can provide an informed road map to identify the origin and transmission of disease outbreaks.

These collections of animals, plants and fungi date back centuries and are the richest sources of information available about life on Earth. They are housed in museums ranging from the Smithsonian Institution to small colleges.

Together, the world’s natural history collections are estimated to contain more than three billion specimens, including preserved specimens of possible hosts of the coronaviruses that have led to SARS, MERS and COVID-19. They provide a powerful distribution map of our planet’s biodiversity over space and through time.

Preserved pathogens

How can researchers channel these collections toward disease discovery? Each specimen – say, a species of pitcher plant from Florida or a deer mouse from arid New Mexico – is catalogued with a scientific name, a collection date and the place where it was collected, and often with other relevant information. These records underpin scientists’ understanding of where host species and their associated pathogens are found and when they occurred there.

Connecting the site of a disease outbreak to potential pathogen hosts that occur in that area can help to pinpoint likely hosts, sources of pathogens, and pathways of transmission from hosts to humans and from one human to another. These natural history collections are connected worldwide through massive online databases, so a researcher anywhere in the world can find information on potential hosts in far-off regions.

But that’s just the beginning. A preserved specimen of a rodent, a bat or any other potential host animal in a collection also carries preserved pathogens, such as coronaviruses. This means that researchers can quickly survey microbes using specimens that were collected decades or more before for an entirely different purpose. They can use this information to quickly identify a pathogen, associate it with particular wild hosts, and then reconstruct the past distributions and evolution of disease-causing microbes and hosts across geographic space.

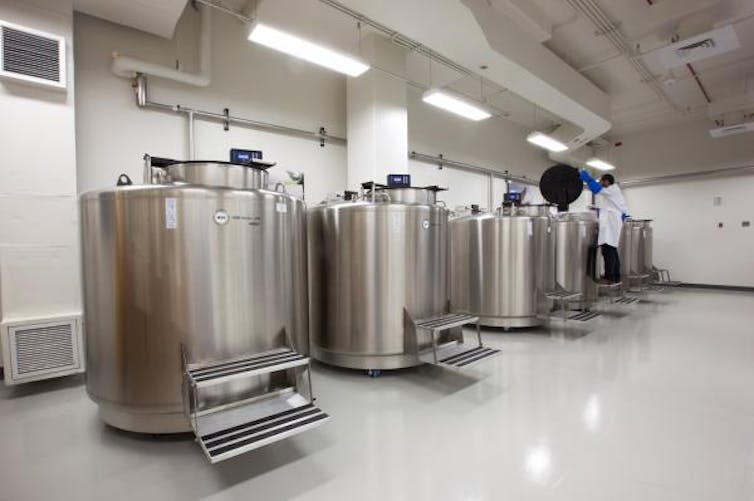
Many collections contain frozen samples of animal specimens stored in special low-temperature freezers. These materials can be quickly surveyed for microbes and possible human pathogens using genetic analysis. Scientists can compare DNA sequences of the pathogens found in animal specimens with the disease-causing agent to identify and track pathways of transmission.

Nitrogen freezers for cryo-preserving specimens in the Smithsonian National Museum of Natural History’s Biorepository. Donald E. Hurlbert/SmithsonianCC BY-ND

For example, museum specimens of deer mice at the University of New Mexico were key to the rapid identification of a newly discovered species of hantavirus that caused 13 deaths in the southwest United States in 1993. Subsequent studies of preserved specimens have revealed many new species and variants of hantaviruses in other rodents, shrews, moles and, recently, bats worldwide.

Equipping museums and connecting scientists

Natural history collections have the potential to help revolutionize studies of epidemics and pandemics. But to do this, they will need more support.

Even though they play a foundational role in biology, collections are generally underfunded and understaffed. Many of them lack recent specimens or associated frozen tissues for genetic analyses. Many regions of our planet have been poorly sampled, especially the most biodiverse countries near the tropics.

To leverage biodiversity science for biomedical research and public health, museums will need more field sampling; new facilities to house collections, especially in biodiverse countries; and expanded databases for scientists who collect the samples, analyze DNA sequences and track transmission routes. These investments will require increased funding and innovations in biomedical and biodiversity sciences.

Another challenge is that natural history curators and pathobiologists who study the mechanisms of disease work in separate scientific communities and are only vaguely aware of each other’s resources, despite clear benefits for both basic and clinical research. We believe now is the time to reflect on how to leverage diverse resources and build stronger ties between natural history museums, pathobiologists and public health institutions. Collaboration will be key to our ability to predict, and perhaps forestall, future pandemics.

***

Pamela Soltis, Joseph Cook, Richard Yanagihara

Museums preserve clues that can help scientists predict and analyze future pandemics

first published in “The Conversation” under a Creative Commons license

Claude Monet, “Hôtel des roches noires. Trouville” (1870)

Claude Monet and his wife Camille were married on 28 June 1870, just before the onset of the Franco Prussian War on 19 July of the same year.

Their wedding trip (paid for by Édouard Manet and Frédéric Bazille) took them to the seaside resort town of Trouville, along the Normandy coast of the English Channel.

Claude Monet (1840-1926), “Hôtel des roches noires. Trouville” (1870, oil on canvas), Musée d’Orsay, Paris

“Hôtel des roches noires. Trouville” (1870, oil on canvas) depicts the fashionable beachfront hotel, built in 1866 in the Second Empire Style (architects: Alphonse-Nicolas Crépinet and Robert Mallet-Stevens).

Monet and his family stayed further from the beach, at the Hotel Tivoli.

“Hôtel des roches noires. Trouville” was acquired by Jean Henry Laroche, Paris, in 1924.

By decree of 7 July 1947 the painting was accepted by the State of France from Jacques Laroches, a donation with life interest reserved.

In 1986 “Hôtel des roches noires. Trouville” was assigned to the Musée d’Orsay, Paris.

Harald Sohlberg, “Winter Night in the Mountains”

A critical and public success upon completion, Harald Sohlberg’s “Winter Night in the Mountains” (Norwegian: “Vinternatt i fjellene”) was acquired by shipowner and collector Jørgen Breder Stang who donated the painting to Oslo’s National Museum (Norwegian: Nasjonalmuseet) in 1918.

Harald Sohlberg, “Winter Night in the Mountains” (1914, oil on canvas) in the collection of the National Museum, Oslo

Engaging the viewer in the captivating bluish moonlight over the mountains of Rondane, the painting is also known as “Winter Night in Rondane” (“Vinternatt i Rondane”).

Sohlberg (1869, Oslo – 1935, Oslo) began work on this painting in 1911. He completed it in 1914 in time for the Jubilee Exhibition of that year.

Note the cross shoveled out of the snow atop the peak to the right.

100 degrees in Siberia? 5 ways the extreme Arctic heat wave follows a disturbing pattern

Mark Serreze

Research Professor of Geography and Director, National Snow and Ice Data Center, University of Colorado Boulder

June 25, 2020 3.17pm EDT • Updated June 26, 2020 2.17pm EDT

***

This Arctic heat wave has been unusually long-lived. The darkest reds on this map of the Arctic are areas that were more than 14 degrees Fahrenheit warmer in the spring of 2020 compared to the recent 15-year average. Joshua Stevens/NASA Earth Observatory

The Arctic heat wave that sent Siberian temperatures soaring to around 100 degrees Fahrenheit on the first day of summer put an exclamation point on an astonishing transformation of the Arctic environment that’s been underway for about 30 years.

As long ago as the 1890s, scientists predicted that increasing levels of carbon dioxide in the atmosphere would lead to a warming planet, particularly in the Arctic, where the loss of reflective snow and sea ice would further warm the region. Climate models have consistently pointed to “Arctic amplification” emerging as greenhouse gas concentrations increase.

Well, Arctic amplification is now here in a big way. The Arctic is warming at roughly twice the rate of the globe as a whole. When extreme heat waves like this one strike, it stands out to everyone. Scientists are generally reluctant to say “We told you so,” but the record shows that we did.

As director of the National Snow and Ice Data Center and an Arctic climate scientist who first set foot in the far North in 1982, I’ve had a front-row seat to watch the transformation.

Arctic heat waves are happening more often – and getting stuck

Arctic heat waves now arrive on top of an already warmer planet, so they’re more frequent than they used to be.

Western Siberia recorded its hottest spring on record this year, according the EU’s Copernicus Earth Observation Program, and that unusual heat isn’t expected to end soon. The Arctic Climate Forum has forecast above-average temperatures across the majority of the Arctic through at least August.

Arctic temperatures have been rising faster than the global average. This map shows the average change in degrees Celsius from 1960 to 2019. NASA-GISS

Why is this heat wave sticking around? No one has a full answer yet, but we can look at the weather patterns around it.

As a rule, heat waves are related to unusual jet stream patterns, and the Siberian heat wave is no different. A persistent northward swing of the jet stream has placed the area under what meteorologists call a “ridge.” When the jet stream swings northward like this, it allows warmer air into the region, raising the surface temperature.

Some scientists expect rising global temperatures to influence the jet stream. The jet stream is driven by temperature contrasts. As the Arctic warms more quickly, these contrasts shrink, and the jet stream can slow.

Is that what we’re seeing right now? We don’t yet know.

Swiss cheese sea ice and feedback loops

We do know that we’re seeing significant effects from this heat wave, particularly in the early loss of sea ice.

The ice along the shores of Siberia has the appearance of Swiss cheese right now in satellite images, with big areas of open water that would normally still be covered. The sea ice extent in the Laptev Sea, north of Russia, is the lowest recorded for this time of year since satellite observations began.

The loss of sea ice also affects the temperature, creating a feedback loop. Earth’s ice and snow cover reflect the Sun’s incoming energy, helping to keep the region cool. When that reflective cover is gone, the dark ocean and land absorb the heat, further raising the surface temperature.

Sea surface temperatures are already unusually high along parts of the Siberian Coast, and the warm ocean waters will lead to more melting.

The risks of thawing permafrost

On land, a big concern is warming permafrost – the perennially frozen ground that underlies most Arctic terrain.

When permafrost thaws under homes and bridges, infrastructure can sink, tilt and collapse. Alaskans have been contending with this for several years. Near Norilsk, Russia, thawing permafrost was blamed for an oil tank collapse in late May that spilled thousands of tons of oil into a river.

Thawing permafrost also creates a less obvious but even more damaging problem. When the ground thaws, microbes in the soil begin turning its organic matter into carbon dioxide and methane. Both are greenhouse gases that further warm the planet.

In a study published last year, researchers found that permafrost test sites around the world had warmed by nearly half a degree Fahrenheit on average over the decade from 2007 to 2016. The greatest increase was in Siberia, where some areas had warmed by 1.6 degrees. The current Siberian heat wave, especially if it continues, will regionally exacerbate that permafrost warming and thawing.

A satellite image shows the Norilsk oil spill flowing into neighboring rivers. The collapse of a giant fuel tank was blamed on thawing permafrost. Contains modified Copernicus Sentinel data 2020CC BY

Wildfires are back again

The extreme warmth also raises the risk of wildfires, which radically change the landscape in other ways.

Drier forests are more prone to fires, often from lightning strikes. When forests burn, the dark, exposed soil left behind can absorb more heat and hasten warming.

We’ve seen a few years now of extreme forest fires across the Arctic. This year, some scientists have speculated that some of the Siberian fires that broke out last year may have continued to burn through the winter in peat bogs and reemerged.

A satellite images shows thinning sea ice in parts of the East Siberian and Laptev Seas and wildfire smoke pouring across Russia. The town of Verkhoyansk, normally known for being one of the coldest inhabited places on Earth, reported hitting 100 degrees on June 20. Joshua Stevens/NASA Earth Observatory

A disturbing pattern

The Siberian heat wave and its impacts will doubtless be widely studied. There will certainly be those eager to dismiss the event as just the result of an unusual persistent weather pattern.

Caution must always be exercised about reading too much into a single event – heat waves happen. But this is part of a disturbing pattern.

What is happening in the Arctic is very real and should serve as a warning to everyone who cares about the future of the planet as we know it.

***

Mark Serreze

100 degrees in Siberia? 5 ways the extreme Arctic heat wave follows a disturbing pattern

first published in “The Conversation” under a Creative Commons license

‘Construction fever’ responsible for one fifth of China’s CO2 emissions

‘Construction fever’ responsible for one fifth of China’s CO2 emissions

Carbon Brief, Josh Gabbatiss

***

The construction and demolition of buildings in China was responsible for nearly a fifth of the nation’s annual CO2 emissions in 2015, according to a new study.

The world’s largest emitter has seen building rates soar as existing structures are torn down and replaced with skyscrapers to house the nation’s rapidly urbanising population.

All of this comes with a significant carbon footprint, both to produce the cement, steel and other materials required and from the emissions produced once the project is underway.

The researchers behind the new study, published in the Journal of Cleaner Production, say this has not received enough attention in China, despite being an “unignorable and critical” component of the nation’s emissions.

However, other academics Carbon Brief talked to said that while China’s construction “boom” is undoubtedly carbon-intensive, there are “issues” with the methods used in this analysis.

‘Construction fever’

A growing urban population and land scarcity have contributed to significant growth in construction – particularly of high-rise buildings – across China.

Since 2010, China has been responsible for around half of the world’s growth in construction, with many buildings only standing for around 30 years before being demolished. 

Their construction, maintenance and demolition all come with a carbon cost. Previous studies have estimated that the energy consumption of China’s building sector has more than tripled since 2001.

Xinyi Shen from Greenpeace East Asia tells Carbon Brief that, given this, it is not surprising that China’s “construction fever” is a primary driver of its emissions.

However, in the new study, a team led by PhD candidate Weina Zhu of Tsinghua University, make the distinction between “operational” and “embodied” CO2 emissions, emphasizing the need to focus on the latter.

Embodied CO2 is defined in the paper as total emissions from “building materials manufacturing and transportation, building construction, maintenance and demolition”. Operational emissions are those arising from day-to-day energy use – for example, lighting, heating and cooling.

The authors say that operational carbon is generally assumed to be the primary contributor to the sector’s emissions, meaning strategies have focused on improving the energy efficiency of buildings.

However, they say that if China is to hit its climate target of peaking emissions in 2030, it will need to make embodied emissions a priority.

Time lapse showing the development that has taken place in Shanghai between 1984-2018. Source: Google Earth Engine

Bottom-up and top-down

The researchers looked at building activity throughout 2015, a year when Chinese economic stimulus – and the construction it helps drive – was reportedly at relatively low levels.

To estimate the embodied CO2 for construction that year – excluding civil engineering projects, such as bridges and roads – the researchers used two different approaches.

First, they used a process-based assessment. This was a “bottom-up” method that involved working out the total emissions of all the processes feeding into Chinese construction, from chemical reactions in cement factories to machinery used on building sites.

For the second assessment they used an input-output model. This was a “top-down” approach for which the team took national data and isolated the relevant components.

One of the paper’s co-authors, Dr Wei Feng, tells Carbon Brief this is “the first systematic analysis” of China’s embodied CO2 emissions using both of these methods.

Results based on the process approach showed that the embodied carbon in the Chinese building sector for that year was 1,422m tonnes of CO2 (MtCO2), while the input-output method settled on 1,600MtCO2.

Based on the upper estimate, they note this was approximately 18% of total Chinese emissions reported in 2015.

Residential buildings had around twice the emissions cost of non-residential buildings. The study notes how China’s housing has shifted from brick and wood to reinforced concrete and steel high-rise structures.

Crucially, the researchers say their estimate puts embodied CO2 roughly on a par with past estimates of operational CO2.

Dr Francesco Pomponi, an engineer at Edinburgh Napier University who was not involved in the study, tells Carbon Brief this seems more plausible than many other comparisons between operational and embodied CO2:

“Previous assessments we have had suggested 20% embodied, 80% operational or less than that, whereas this study is pointing towards a more realistic picture – about half and half.”

As a comparison, a report from last year by the World Green Building Council concluded 11% of annual global emissions were from carbon embodied in building construction processes. Nearly three times as much came from operational building emissions.

While around 10% of European states’ annual emissions can be traced to embodied building carbon, Pomponi says a value of roughly double this seems accurate for an economy such as China.

“I go every year so I see the difference year after year in how much built stock was added in 12 months,” he says.

‘Red flags’

However, Dr Jannik Giesekam, an industrial climate policy researcher at the University of Leeds who has worked extensively in this area but was not involved in the study, tells Carbon Brief he identified numerous “red flags” in the research.

While he thinks the researchers probably arrived at the right “ballpark figure”, he has “major” issues with the paper that he thinks compromise the results.

One of the key points he identified was that the paper overlooked a lot of pre-existing work on embodied carbon, including databases prepared by industry “in favour of a selective set of case studies”.

He also says the paper does not make a comparison with previous estimates for China or to previous systematic reviews prepared by the likes of the International Energy Agency (IEA).

While acknowledging some of these points as valid, Feng says they chose case studies that reflect current Chinese common practices and that they could not retrieve the relevant emissions data from the industry databases Giesekam suggests. 

“Overall, it would be different and unrealistic to use international emission data and best practices to represent China’s emission in 2015,” he tells Carbon Brief.

For his part, Pomponi says that while Giesekam’s criticism is valid, he sees things “slightly differently”. He says: “I think it’s impossible that a study incorporates everything that’s out there.”

Giesekam also notes what he sees as some unusual choices in the way the researchers carried out the study, including a lack of detail in both their “bottom-up” and “top down” calculations – for example, giving all steel the same “carbon factor”.

Feng says that while they would “love this study to go deeper” and describes his team’s work in this area as on-going, he notes they used a “simple approach” that involved taking averages of steel and cement data:

“That is why we also employ a top-down method to cross-validate the bottom-up method calculation to make sure the total emission results match with each other.”

To this point, Pomponi tells Carbon Brief it is “inevitable to sacrifice depth for breadth in academic research” and says that, while there are certainly issues with the paper, he thinks it is valuable to see different methods being used to assess embodied carbon:

“It’s really good they used two [approaches] and compared them. They are extremely different methods so it’s good that they seem to point to the same number.”

Construction workers on a residential building site in Huaian city, China. Credit: Imaginechina Limited / Alamy Stock Photo.

Cutting embodied CO2

The researchers say that on a global scale, the relatively limited attention paid to embodied carbon is preventing an accurate assessment of the building sector’s environmental impacts.

Dr Danielle Densley Tingley, an architectural engineer at the University of Sheffield who was not involved in the work, says these emissions are generally not given sufficient attention by nations setting climate targets. She tells Carbon Brief this is partly due to the way they are reported:

“They’re often lumped into ‘industrial emissions’. This focuses on the production of the materials – where there are only small efficiencies left to gain – but doesn’t really look at how the materials are then used, what is driving their consumption etc.”

She says better design and a focus on “deep retrofits” instead of demolition would help cut embodied emissions in buildings. Pomponi agrees that design lies at the heart of this issue:

“At the moment we are inefficient in the sense that we put more material than is actually needed into buildings … Firms tend to go with ‘rules of thumb’ or things that worked in the past rather than starting from scratch.”

Measures have been proposed to cut these emissions in some countries. The World Green Building Council has set a target of 40% less embodied carbon in all new buildings, infrastructure and renovations by 2030.

The authors of the new study estimate that, despite a focus on operational carbon emissions in China, the annual potential for reductions in the building sector could actually be larger for embodied than operational CO2.

Greenpeace East Asia’s Shen says that after years of intensive construction the situation is shifting and, going forward, the Chinese authorities are going to have to be “extremely careful” about what they build:

“The country has entered into a new stage of development in that blindly putting up more infrastructure is not only environmentally unsustainable but also will not keep the same investment return the country yielded in the last decades.”

Zhu, W. et al. (2020) Analysis of the embodied carbon dioxide in the building sector: A case of China, Journal of Cleaner Production, doi.org/10.1016/j.jclepro.2020.122438

***

‘Construction fever’ responsible for one fifth of China’s CO2 emissions

Josh Gabbatiss

Originally published under a CC license by Carbon Brief on 9 June 2020

Published under a CC license. You are welcome to reproduce unadapted material in full for non-commercial use, credited ‘Carbon Brief’ with a link to the article.

IEA: Coronavirus ‘accelerating closure’ of ageing fossil-fuelled power plants

IEA: Coronavirus ‘accelerating closure’ of ageing fossil-fuelled power plants

Josh Gabbatiss, Carbon Brief, 27 May 2020

***

This year will see the largest ever drop globally in both investment and consumer spending on energy as the coronavirus pandemic hits every major sector, according to the International Energy Agency (IEA).

The crisis is accelerating the shutdown of older fossil-fuelled power plants and refineries, with the agency saying it could provide an opportunity to push the global energy sector onto a “more resilient, secure and sustainable path”.

In the latest edition of the World Energy Investment report, which Carbon Brief has covered in previous years, the IEA has gone beyond its usual remit of reviewing annual trends. 

Its analysis looks ahead to the coming year and estimates the impact of this year’s economic turmoil on energy investment, which was expected to grow by around 2% prior to Covid-19. It is now expected to drop by 20%, or almost $400bn.

Meanwhile, as demand and prices collapse, consumer spending on oil is expected to drop by more than $1tn, prompting a “historic switch” as spending on electricity exceeds oil for the first time.

Here, Carbon Brief has picked out some key charts to illustrate the economic repercussions of the pandemic across the energy sector.

Energy investment will drop by a fifth

The “baseline expectation” for 2020 is a global recession resulting from widespread lockdowns, according to the IEA. Last month, the agency estimated this will also lead to CO2 emissions dropping by 8% this year in the largest decline ever recorded.

Based on the latest investment data and project information, announcements from companies and governments, interviews with industry figures and its own analysis, the IEA concludes such a recession will see energy investment drop by a fifth. This can be seen in the chart below.

Energy investment is set to fall by a fifth in 2020 due to the coronavirus pandemic. Fuel supply (red) includes all investments associated with the production and provision of fuels to consumers, consisting mainly of oil, gas and coal investments. Power sector (blue) includes spending on power-generation technologies, grids and storage. Energy end use and efficiency (yellow) includes the investment in efficiency improvements across all end-use sectors. Source: IEA

These estimates are based on assumptions about the duration of lockdowns and coronavirus recovery trajectories.

The IEA notes that “almost all” investment activity has been disrupted by these measures, as a result of restrictions to the movement of people, goods and equipment. 

However, the largest impacts are the result of declines in revenues due to falling demand and prices, with the clearest example coming from the oil sector. Analysis of daily data until mid-April suggests countries in full lockdown have seen energy demand drop by a quarter.

As a result, the agency also estimates that these factors, combined with a rise in cases of people not paying their energy bills, will see revenues going to both governments and industry fall by over $1tn this year.

Crisis ‘accelerating’ shift from low-efficiency technologies

Every year energy infrastructure is retired and replaced with new equipment. Typically, the replacement technologies will be cleaner and more efficient, although this is not always the case. 

The coronavirus crisis is expected to have an impact on this rate of turnover and, indeed, it is already contributing to the retirement of some older power plants and facilities, as the chart below illustrates.

The Covid-19 crisis is hastening the retirement (light blue) of some older plants and facilities, but also impacting consumer spending on new and more efficient technologies (dark blue), with the potential for a net decrease (yellow dot) in upstream oil-and-gas facilities. Source: IEA.

The economic downturn and “surfeit of productive capacity in some areas” as overall demand plummets is already “accelerating” the closure and idling or inefficient technologies, including refineries and some coal-fired power plants.

However, the IEA warns that equally governments might respond to the pandemic by underinvesting in new technologies and remaining reliant on inefficient, older technology. The agency estimates efficiency investment could drop by 10-15% as spending is cut back.

The report warns that policymakers should keep these elements in mind and “combine economic recovery with energy and climate goals”. Dr Fatih Birol, executive director of the IEA, said in a statement that while the pandemic has brought lower emissions it has been “for all the wrong reasons”:

“The response of policymakers – and the extent to which energy and sustainability concerns are integrated into their recovery strategies – will be critical.”

Clean energy spending ‘relatively resilient’

The share of global energy spending going towards clean energy, including renewables as well as nuclear and efficiency improvements, has been flat-lining at around one-third for the past few years.

As the chart below shows, this is likely to change this year as clean energy’s share edges closer to two-fifths of overall spending.

Breakdown of clean energy investment by sector in USD (left x-axis), with the % overall share (right x-axis) of spending indicated by a grey line. Source: IEA.

Clean energy investment is expected to remain “relatively resilient” this year, with spending on renewable projects falling by a comparatively small 10%. 

However, according to the IEA, the main reason for clean energy increasing its share is that fossil fuels are set to take such a “heavy hit”. In absolute terms, spending on these technologies is “far below levels” required to accelerate energy transitions.

The agency notes that investment trends have long been “poorly aligned” with the world’s needs and are still set to fall short of the future it has outlined in its benchmark Sustainable Development Scenario (SDS).

Last year’s edition of the World Energy Investment report concluded that investment in low-carbon energy sources must more than double by 2030 if the world is to meet its Paris Agreement targets.

While the slowdown in clean energy spending is less significant, it still “risks undermining the much-needed transition to more resilient and sustainable energy systems,” according to Birol.

Power sector hit hard

International power investment is set to drop by 10% as a result of the Covid-19 pandemic, according to the agency. 

Virtually every component of the sector is expected to see a decline in investment, with hydro the only exception, as the chart below demonstrates.

Global investment in the power sector by technology, with figures from the previous three years and estimates for 2020 (yellow). Source: IEA.

Increases in residential electricity demand around the world during lockdown are being “far outweighed” by reductions in commercial and industrial operations, the agency reports. A 9% decline in spending on electricity networks this year is also expected.

The IEA says some parts of power investment are more exposed, specifically fossil fuel-based generation. 

Meanwhile, higher shares of renewables are being dispatched due to low operating costs and priority access to networks. Nevertheless, renewables are still taking a hit, particularly distributed solar photovoltaics (PV) as households and companies cut back on spending.

Technologies with a longer lead time, notably offshore wind and hydropower, are expected to do better despite some delays.

Electricity spending pulls ahead of oil

Oil accounts for most of the decline in revenues expected this year. Furthermore, in a “historic switch” consumer spending on electricity could exceed spending on oil for the first time ever. 

While power-sector revenues are expected to fall by $180bn, oil spending will likely drop by at least $1tn. This can be seen in the chart on the left below. Taken together, investment in oil and gas is expected to fall by almost a third in 2020. 

Both global end-use spending by consumers on energy (left) and estimated 2020 investment compared to 2019 show oil is expected to see the biggest decline in investment activity this year. Source: IEA.

The decline in aviation and road transport, which represent nearly 60% of oil demand, are responsible for this disproportionate decline.

Meanwhile, the impact on gas has so far been more moderate, but could fall further due to reduced demand in power and industry settings.

The report also highlights the global shale sector, which was already under pressure, as being particularly vulnerable. 

With investor confidence and access to capital in decline, the IEA predicts shale investment will halve in 2020 and notes the outlook for “highly leveraged shale players in the US” is now “bleak”.

Coal decline given a ‘floor’ by China

Coal is estimated to be the fuel hardest hit by the crisis after oil. Coal demand could drop by 8% this year, investment in coal supply is set to fall by a quarter and spending on new coal-fired plants is set to fall by around 11%.

However, any decline in coal’s fortunes may be curtailed by the recovery of demand for the fossil fuel in China. According to the IEA, investment activity there “may put a floor” under further reductions in coal-power investment this year.

The nation’s focus on coal is illustrated in the chart below, which shows final investment decisions (FIDs) dropping to their lowest levels in a decade, but China providing virtually all of them in the year so far.

Coal-fired power generation capacity (GW) subject to a final investment decision (FID), with China coloured in green. Source: IEA.

Using data available so far, the IEA notes that approvals for new coal plants in the first quarter of 2020, were “running at twice the rate observed over 2019 as a whole”, primarily in China.

Electric vehicle sales rising as overall market contracts

Last year was a difficult time for the car industry, with total sales growth slowing in all major regions and turning negative in China and the US.

However, this “turbulent” period for the industry is “likely to appear mild” in comparison with 2020, according to the IEA. 

Lockdowns have already severely impacted sales and, across the year, the agency estimates a drop of around 15% – dramatic even compared to the 10% drop that followed the 2008 financial crisis. Negative trends in overall car sales can be seen in the right-hand chart below.

Global sales of electric passenger vehicles – cars, vans and small trucks – and market share, indicated by a red line (left chart). Total light-duty vehicle sales (right). Source: IEA.

However, even though electric vehicle sales followed wider patterns and stalled in 2019 largely due to declining Chinese purchases, their overall market share continued to climb. 

This can be seen in the chart on the left, which shows that electric cars are expected to go against the broader trend in 2020. The IEA estimates that owing to policy support, particularly in Europe, electric vehicle sales will increase this year, as will their share of the market (indicated by the red line).

Battery storage spending fell as prices dropped

Investment in battery storage fell for the first time last year, as the chart below shows. Overall, spending on grid-scale and behind-the-meter batteries fell by 15%, with overall investment just above $4bn.

Investment in both grid-scale (left) and behind-the-meter battery storage (right). Source: IEA.

The IEA states this decline took place as costs for battery storage fell rapidly, a trend the agency attributes to maturing supply chains and markets, more efficient production and competition within the sector.

The report mentions fires at energy storage installations in South Korea and regulation uncertainty in China as some of the factors behind the decline in interest last year.

Declining behind-the-meter battery spending also reflects the distributed solar PV market, for which investment slowed last year in a trend expected to continue as consumer spending drops off due to coronavirus.

The agency notes that grid-scale battery investments are also expected to decline this year against the backdrop of a general decrease in power activity. 

However, it says this setback “is likely to be shortlived” due to the technology’s growing importance for system security and flexibility. 

***

IEA: Coronavirus ‘accelerating closure’ of ageing fossil-fuelled power plants

Josh Gabbatiss, Carbon Brief, 27 May 2020

Published under a CC license. Carbon Brief welcomes the reproduction of unadapted material in full for non-commercial use, credited ‘Carbon Brief’ with a link to the article.

intentionality & the post-covid cultural landscape

Individually we are no match for nature. Together we are.

Stewart Simonsen, Assistant Director-General, World Health Organization; in conversation with Fareed Zakaria, GPS, 24 May 2020

Congress will have to think with knowledge that we will have another crisis.”

Gary Cohn, Former Director, National Economic Council, Former President & Chief Operating Officer, Goldman Sachs, in conversation with Fareed Zakaria, GPS, 24 May 2020

Given the health, governance, and legal risks posed by the coronavirus and the covid-19 response, a primary issue affecting us all, including galleries, museums, and cultural organizations around the world, has been how to limit its spread. As a prophylactic vaccine has not yet been developed, decisions were made to limit possible exposure and contagion by distancing people from one another. In many countries all organizations and enterprises except those providing what have been considered “essential” services were closed, museums included.

Museums are public spaces that welcome people through their doors into shared spaces to look at art together. They have had to grapple with the questions of whether or not and how to engage their audiences while closed. They grapple now with the question of how best to re-open while continuing to mitigate the risk of contagion and spread.

The learning curve has been steep and rapid. Marc Spiegler, Global Director of Art Basel, and museum leaders from Asia, Europe, and the United States addressed the learning curve and responses of the museum sector during a webinar discussion that took place on 21 May,  “How will the pandemic change institutions?

Dr. Zoé Whitley, director of the Chisenhale Gallery, London, Anne Pasternak, Shelby White and Leon Levy Director of the Brooklyn Museum, New York City, Phlip Tinari, director and CEO of the UCCA Center for Contemporary Art, Beijing, and Dr. András Szántó, author and cultural strategy advisor, New York City, shared their thoughts and perspectives on the missions, priorities, and activities of their organizations, how they were managing during the pandemic and concomitant shut-down, risks, risk management, and ways to make it possible to be back in physical spaces looking at art with other people.

“What roles should institutions play in the post-covid cultural landscape, assuming you can even guess what the landscape is going to be?”

Acknowledging that “we have a responsibility to re-think how we remain relevant to our audiences,” Dr. Whitley asked, “how do you start charting a new path under these incredibly strange circumstances?”

“I think that’s precisely the question,” she continues. “What might rank as the world’s worst hypothetical interview question: how would you lead an organization remotely in the midst of a global pandemic? And you would think it was so absurd as to be not really be able to entertain it. And yet here we are.”

While understanding that the pandemic and the global response caught many off guard, knowing what we now know, we may need to revisit underlying assumptions of absurdity and re-map our thinking. The pathogen and pandemic did not come out of nowhere.  See: “Q&A: Could climate change and biodiversity loss raise the risk of pandemics?“.

Pathogens such as the coronavirus that is causing the covid-19 response occur abundantly in nature. As we, through our many behaviors, draw closer to wild animals, for instance, and draw them closer to us, and unless we work consistently and with intention to acknowledge, manage, and mitigate risk, we may expect ever more such pandemics.

The UCCA Center for Contemporary Art in Beijing may serve as a case study. Having closed its doors on 24 January, the UCCA re-opened to the public on 21 May. 

Philip Tinari reflected on the disappearance of everyday routine during the closure, the mood of solemnity of everyday existence, the poignancy of being back in physical space looking at art with people,  and the freedom to enter into a public space and look at art.

He observed that while “it’s poignant and it’s just wonderful to be back in physical space looking at art with people, … that can only happen because of larger dynamics in the society.”

“The freedom to enter into a public space and look at art,” the freedom to enter the UCCA Center for Contemporary Art, and Beijing’s 798 Art District in which it is located, is afforded by measures taken to control the contagion and spread.

“To even enter into 798, one needs to have one’s temperature taken and one needs to show a kind of virtual pass which is generated by a government app that, you know, tracks your data and proves that you have not been in any high-risk areas for the last 14 days or 21 days, and even, in some cases, synchs to facial-recognition thermometers that are around town. So, there’s a complete panopticon, and we’re the indirect beneficiaries of it.

“And at our door, there’s another temperature check as there is at the entrance of any restaurant or store. And masking here is completely mandatory and universal. And so then it just becomes a question of how to be responsible and keep things disinfected and use our guards to keep people distanced.

From “How technology is safeguarding health and livelihoods in Asia,” Oliver Tonby, Jonathan Woetzel, Noshir Kaka, Wonsik Choi, Jeongmin Seong, Brant Carson, and Lily Ma,McKinsey & Company, 12 May 2020

“I guess all to say that we’re all kind of working inside the contexts where we find ourselves. And this one, for the draconian nature of certain measures, they paradoxically allow for the freedom to enter into a public space and look at art.”

As risks abound, continue, and even, arguably, increase, it is crucial to plan and conduct business smartly, in a forward-looking manner, clearly articulating desired outcomes, on the one had, and negative externalities, that are increasingly no longer external, on the other.

UCCA has postponed shows that were on the calendar for this year, “many of which involved intense overseas collaborations and were not going to happen as scheduled.” Yet, learning as early as early March that the museum re-opening would take place on 21 May, the first date also of the re-scheduled Beijing Gallery Week-end, Mr. Tinari and the museum curators realized “that there was no way we could get to May 21 and not have something to show everyone.”

“And so I sat in a room with my curators for about a week. And we came up with an exhibition that we titled “Meditations in an Emergency” after the Frank O’Hara anthology which kind of looks at the post-covid world from five different angles. Everything from the disappearance of everyday routine to the relationship between humans and animals to the proliferation of a sort of de-centered polyphonic or contradictory narrative around news and information.

“It’s a 26-artist group show that’s actually, I don’t mean to brag or anything, but it’s really beautifully installed. And it’s poignant and it’s just wonderful to be back in physical space looking at art with people.”

Zhang Hui, “Just Line in the Mirror 2” (2018, oil on canvas).
Credit: Zhang Hui and UCCA, Center for Contemporary Art, Beijing: “Meditations in an Emergency,” 21 May – 30 August 2020

Thinking forward, Mr. Tinari observes “a certain solemnity to just everyday existence now. People are ready to come. And in a way that’s a very not the worst frame of mind with which to enter into an exhibition.”

What he’s been calling “the new intentionality,” engaging in activities “with a very specific purpose and for a limited duration,” applies, he says, to programming as well. “It’s not that we won’t continue to do big international shows but we’ll do them for specific reasons with kind of very measurable goals in more measured ways.”

See:

Art Basel, “How will the pandemic change institutions?“, YouTube, 22 May 2020

Oliver Tonby, Jonathan Woetzel, Noshir Kaka, Wonsik Choi, Jeongmin Seong, Brant Carson, and Lily Ma, “How technology is safeguarding health and livelihoods in Asia,” McKinsey & Company, 12 May 2020

Zoé Whitley, Star Curator Behind Acclaimed ‘Soul of a Nation’ Show, Named Director of London’s Chisenhale Gallery,” ARTnews, 17 January 2020

UCCA, Center for Contemporary Art, Meditations in an Emergency, 21 May 2020 – 30 August 2020


Kehinde Wiley: “St. Andrew”

Kehinde Wiley’s “St. Andrew” (oil and enamel on canvas in an antiquated frame with gilded ornament) of 2006.

A young man in contemporary street-wear straddles the cross on which he will die. The unusual cross is associated with St. Andrew, a disciple of Christ who was executed for refusing to renounce his faith.

Kehinde Wiley, “St. Andrew” (2006, oil and enamel on canvas in antiquated frame with gilded ornaments; detail)

Kehinde Wiley poses his contemporary St. Andrew against rich brocade that comes to life as it winds over the figure.

Kehinde Wiley, “St. Andrew” (2006, oil and enamel on canvas in antiquated frame with gilded ornaments)

The subject is painted in a powerful and dramatic Baroque style in strong contrast to the flat background.

Born in Los Angeles in 1977, Kehinde Wiley now lives and works in New York. He earned his BFA from the San Francisco Art Institute in 1999 and his MFA from Yale in 2001. He holds an honorary doctorate from the  Rhode Island School of Design.

Represented by New York gallerist Sean Kelly, Wiley

“has firmly situated himself within art history’s portrait painting tradition.

“As a contemporary descendent of a long line of portraitists, including Reynolds, Gainsborough, Titian, Ingres, among others,

“Wiley engages the signs and visual rhetoric of the heroic, majestic, and the sublime in his representation of urban, black and brown men found throughout the world.”

Kehinde Wiley, Sean Kelly

Kehinde Wiley’s “St. Andrew,” a museum purchase of 2014, is now in the collection of Norfolk, Virginia’s Chrysler Museum of Art.

See:

Kehinde Wiley, Sean Kelly

Kehinde  Wiley, Chrysler Museum of Art

art, the built environment, & the Bizot Green Protocol

Works of art. History. Cultural heritage. The market. Galleries. Art fairs. Museums. Private museums. Institutional and private collections. Fiduciary care. Value.

Let’s consider a pressing issue:

How collections are housed, managed, and cared for and the protection of works of art and tangible assets in an age of increasingly erratic weather, increasing sea-level rise, floods, fires, storms, … and pandemics – which in themselves and the response to which can be devastating.

Does one barricade the art behind flood walls and barriers? Insure the works of art? (Insurance is a good idea. Insurance does not, however, mitigate or prevent future damage. Insurance is used to protect the “value” of the art, not the work of art itself. It is used after damage occurs to recover value.)

Can we protect works of art while mitigating possible future damage?

Atmospheric CO2 is a key factor leading towards the storms, floods, and fires that can be so damaging to art and tangible assets. Is it possible to care for our collections while reducing emissions of CO2 into the air?

The Bizot Group of museum directors, or the International Group of Organizers of Large-scale Exhibitions, thinks so.

Max Hollein, now the Director of New York’s Metropolitan Museum of Art, was Chairman of the Bizot Group in 2014. Richard Armstrong, Director of the Solomon R. Gugenheim Museum, and Glen Lowry, Director of the Museum of Modern Art, are members.

Wangechi Mutu (Kenyan, born Nairobi, 1972), “The Seated II” (bronze, 2019) situated in one of four niches in the facade of New York’s Metropolitan Museum of Art. Courtesy of the the artist, the Metropolitan Museum of Art, and Gladstone Gallery, New York and Brussels.


Wangechi Mutu (Kenyan, born Nairobi, 1972), “The Seated II” (bronze, 2019). Courtesy of the the artist, the Metropolitan Museum of Art, and Gladstone Gallery, New York and Brussels.

Axel Rüger, Director of the Van Gogh Museum in Amsterdam from 2006 until June of 2019 when he left the Van Gogh Museum to take up a new appointment as Chief Executive of London’s Royal Academy of Arts, is a member.

So are many others.

The Bizot Group agreed the Bizot Green Protocol in 2015:

The directors agree that museums can reduce the amount of CO2 emissions they are responsible for while recognizing their duty of care to collections:

1.  Guiding Principles
Museums should review policy and practice, particularly regarding loan requirements, storage and display conditions, and building design and air conditioning systems, with a view to reducing carbon footprints.

Museums need to find ways to reconcile the desirability of long-term preservation of collections with the need to reduce energy use.

Museums should apply whatever methodology or strategies best suit their collections, building and needs, and innovative approaches should be encouraged.

The care of objects is paramount. Subject to this,

environmental standards should become more intelligent and better tailored to specific needs. Blanket conditions should no longer apply. Instead conditions should be determined by the requirements of individual objects or groups of objects and the climate in the part of the world in which the museum is located;

where appropriate, care of collections should be achieved in a way that does not assume air conditioning or other high energy cost solutions. Passive methods, simple technology that is easy to maintain, and lower energy solutions should be considered;

natural and sustainable environmental controls should be explored and exploited fully;

when designing and constructing new buildings or renovating old ones, architects and engineers should be guided significantly to reduce the building’s carbon footprint as a key objective;

the design and build of exhibitions should be managed to mimimise waste and recycle where possible.

2.  Guidelines
For many classes of object containing hygroscopic material (such as canvas paintings, textiles, ethnographic objects or animal glue) a stable relative humidity (RH) is required in the range of 40 – 60% and a stable temperature in the range 16-25°C with fluctuations of no more than ±10% RH per 24 hours within this range. More sensitive objects will require specific and tighter RH control, depending on the materials, condition, and history of the work of art. A conservators evaluation is essential in establishing the appropriate environmental conditions for works of art requested for loan.

Environmental Sustainability – reducing museums’ carbon footprint,”National Museum Directors Council

See:

Environmental sustainability – reducing museums’ carbon footprint,” National Museum Directors Council

Wangechi Mutu: The NewOnes, will free us,” Metropolitan Museum of Art, The Facade Commission, 9 September 2019 – 9 June 2020

Wangechi Mutu, Gladstone Gallery

Axel Rϋger Appointed Chief Executive of London’s Royal Academy of Arts,” Artforum, 13 February 2019

Axel Rüger,” 40 Under 40 Europe 2018, Apollo Magazine, 3 September 2018

Groupe Bizot, Letter of 26 February 2014 to Mr. Mikhail Piotrovsky, Director, State Hermitage Museum, St. Petersburg, Russia

Daily global CO2 emissions ‘cut to 2006 levels’ during height of coronavirus crisis

Daily global CO2 emissions ‘cut to 2006 levels’ during height of coronavirus crisis

Simon Evans, Carbon Brief, 19 May 2020

***

The amount of CO2 being released by human activity each day fell by as much as 17% during the height of the coronavirus crisis in early April, a new study shows.

This means daily emissions temporarily fell to levels last seen in 2006, the study says. In the first four months of the year, it estimates that global emissions from burning fossil fuels and cement production were cut by 1,048m tonnes of CO2 (MtCO2), or 8.6%, compared with 2019 levels.

The research projects a decline of up to 2,729MtCO2 (7.5%) in 2020 as a whole, depending on how the crisis plays out. It is the first to have been through the peer-review process and is broadly in line with an early estimate for China published by Carbon Brief in February, as well as separate global estimates published last month by Carbon Brief and the International Energy Agency.

Today’s study also marks the first-ever attempt to quantify CO2 emissions on a daily basis, for the world and for 69 individual countries, in close to real time. Until now, annual CO2 emissions data has typically been published months or even years later.

A publicly available daily estimate of global or national CO2 emissions would be “incredibly useful, particularly for motivating policy action and pressure”, another researcher tells Carbon Brief.

Coronavirus crisis

The ongoing coronavirus crisis has claimed the lives of hundreds of thousands of people around the world and seen the introduction of severe restrictions on movement in many countries.

These lockdowns have included “stay at home” orders, border closures and other measures that have had direct effects on the use of energy and, consequently, on the release of CO2 emissions.

As the crisis has unfolded, so too have attempts to quantify its impact on CO2 emissions. These efforts have been challenging, however, because real-time CO2 emissions data does not exist.

The annual emissions inventories that countries submit to the UN take years to compile – and even these are estimates rather than direct measurements.

Greenhouse gas emissions are estimated using a variety of methods, often based on “activity data”. This might be the number of miles being driven, the amount of electricity generated or even – in the case of nitrous oxide, which is used as a propellant  – via cream consumption.

Today’s study, published in Nature Climate Change, combines activity data for six sectors with a “confinement index” of lockdown measures in each country or region over time.

This allows for an estimate of changes in daily global CO2 emissions in January-April 2020, relative to the 100MtCO2 released on an average day in 2019.

During peak confinement in individual countries, daily CO2 emissions fell by 26% on average, the paper says. However, the size of this effect is reduced at a global level, because not all countries were under the most severe type of lockdown at the same time.

At the peak of the crisis in early April, regions responsible for 89% of daily CO2 emissions were under some form of lockdown, the paper says. Daily global CO2 emissions fell to 83MtCO2 (-17%, with a range of -11 to -25%) on 7 April, equivalent to levels last seen in 2006.

In a press release, lead author Prof Corinne Le Quéré, professor of climate change science at the University of East Anglia’s Tyndall Centre (who will be a panelist at Carbon Brief’s webinar on 21 May), says:

“Population confinement has led to drastic changes in energy use and CO2 emissions. These extreme decreases are likely to be temporary, however, as they do not reflect structural changes in the economic, transport, or energy systems.”

Daily data

In order to estimate daily global CO2 emissions, the researchers use a novel approach that combines sectoral activity data with a country-by-country confinement index.

The paper looks at six sectors, shown in the chart below according to their share of global CO2 emissions from fossil fuels and cement. These are electricity and heat (44%); industry (22%); surface transport (20%); homes (6%); public buildings and commerce (4%); and aviation (3%).

Share of global CO2 emissions from fossil fuels and cement due to each of six sectors of the economy. Source: Le Queré et al. (2020). Chart by Carbon Brief.

Notably, this split highlights the limited potential for individual actions to radically reduce global emissions, in contrast to the societal choices that govern CO2 from electricity and industry.

The split in global CO2 emissions, shown above, is then broken down further for each of 69 countries, 50 US states and 30 Chinese provinces, which account for 97% of the global total. This gives industrial CO2 emissions in Italy, for example, on an average day in 2019.

The paper then uses 669 datasets, covering each of these sectors over time, and classified according to the level of confinement in place at each point. For example, this might be daily reports on mobility, traffic and congestion to measure “activity” for surface transport.

This daily data is then adjusted to remove effects unrelated to coronavirus, such as the mild northern hemisphere winter or the day of the week.

Under the highest level of confinement, surface transport “activity” fell by 50% on average, the paper finds. This is shown in green in the chart, below, where each dot represents a single data point, open circles show the average and the horizontal lines show the variability between datasets. The chart also shows changes in activity for electricity, industry, homes and aviation.

Change in sectoral “activity” under the highest level of coronavirus confinement, percent, relative to an average day in 2019. Each dot represents a single datapoint and open circles show the average. Reading from left to right, the chart shows activity changes in the power sector (purple), industry (yellow), surface transport (green), homes (blue) and aviation (pink). Source: Le Queré et al. (2020).

For electricity, the paper looks at total daily demand in Europe, the US and India, finding an average 15% reduction in demand under strict lockdown. In industry, the paper looks at daily coal use in China reported by Carbon Brief and weekly reports on steel production in the US.

For homes, the paper draws on figures from UK smart meters. And for aviation – the most strongly affected sector – it uses data on domestic and international departures around the world.

As the chart above shows, the analysis relies on relatively sparse information for industry, whereas activity levels in transport draw on a wider range of datasets.

Emissions estimates

The team then uses the average change in activity, for each sector and level of confinement, to build up an estimate of daily CO2 emissions around the world.

For example, on days when Turkey is under the strictest lockdown, the analysis assumes that its power-sector CO2 emissions would fall by 15% compared with the average in 2019 – and those from surface transport by 50%.

When Turkey shifts from “confinement index three”, the strictest controls, down to level two, its power-sector emissions would be 5% below usual levels and transport 40% lower. For each confinement level, the same percentage reductions are assumed to apply to all countries.

This approach means that the team only needed to know when each country, state or province changed its coronavirus lockdown from one “confinement level” to another, as well as the daily average level of CO2 emissions from each sector in 2019.

Putting all of these countries and lockdown levels together, the paper finds that the cut in daily global CO2 emissions peaked at -17% on 7 April, shown in the figure, below. Across the first four months of 2020, emissions fell by 1,048MtCO2 (8.6%), compared with 2019 levels.

Estimated daily global CO2 emissions from fossil fuels and cement, million tonnes (MtCO2 per day). The left panel shows emissions from 1970-2020 and the right panel shows the first four months of 2020. Source: Le Queré et al. (2020).

Within this global total, the largest impacts were in China, where emissions fell by an estimated 242MtCO2 in the first four months of the year, followed by the US (-207MtCO2), Europe (-123MtCO2) and India (-98MtCO2).

Dr Glen Peters, research director at Norwegian climate institute Cicero and one of the study authors, tells Carbon Brief that while the approach was designed around the current crisis, the team has gathered the “raw material” to make daily CO2 estimates on an ongoing basis. He says:

“We have discussed more ‘real-time’ estimates for sometime and there are many advantages. We are illustrating one advantage with our paper to see the consequences of particular policy interventions in near real time.”

But Peters notes that some of the daily data they used – the urban congestion index series from satnav maker TomTom, for example – is only being made publicly available during the current crisis and might be made private again in the future. He also asks whether daily data is truly needed, or whether weekly or even monthly estimates might be sufficient for scientists and policymakers.

Dr Hannah Ritchie, head of research at website Our World in Data and one of the reviewers of the new study, tells Carbon Brief:

“I think daily CO2 estimates would be incredibly useful, particularly for motivating policy action and pressure…Climate change already has the classic long-termism problem, but this is exacerbated by the fact that we get a figure on CO2 emissions published once a year, as a marker of how each country is doing.”

If daily CO2 estimates were publicly available for all countries, it would become possible to actively track progress, she says, adding: “You can have a counter on the news, or an app or dashboard on your phone – just like we do with other metrics like stock markets.”

Alternative analyses

Today’s research is not the first to analyse the CO2 impacts of the coronavirus crisis, although it is the first to have completed its passage through peer review.

Another paper, which is currently in review, also attempts to estimate daily global CO2 emissions in close to real time. This work finds the coronavirus crisis cut global emissions by -542MtCO2 below 2019 levels in the first quarter of 2020, similar to the -530MtCO2 figure from today’s paper.

In mid-February, Carbon Brief published an analysis showing that emissions in China were temporarily cut by 200MtCO2 (25%) over a four-week period, during the height of the restrictions. The new study finds that the cut in Chinese emissions peaked at 24%.

Today’s research also includes estimates of the emissions impact in 2020 as a whole, based on three scenarios for the length of lockdowns around the world. These entail CO2 emissions falling by between -4% and -8%, depending on how the crisis plays out. This range is consistent with estimates published in April byCarbon Brief (-6%) and the International Energy Agency (-8%).

***

Daily global CO2 emissions ‘cut to 2006 levels’ during height of coronavirus crisis

Simon Evans, Carbon Brief, 19 May 2020

Published under a CC license. You are welcome to reproduce unadapted material in full for non-commercial use, credited ‘Carbon Brief’ with a link to the article.