IEA: Coronavirus ‘accelerating closure’ of ageing fossil-fuelled power plants

IEA: Coronavirus ‘accelerating closure’ of ageing fossil-fuelled power plants

Josh Gabbatiss, Carbon Brief, 27 May 2020

***

This year will see the largest ever drop globally in both investment and consumer spending on energy as the coronavirus pandemic hits every major sector, according to the International Energy Agency (IEA).

The crisis is accelerating the shutdown of older fossil-fuelled power plants and refineries, with the agency saying it could provide an opportunity to push the global energy sector onto a “more resilient, secure and sustainable path”.

In the latest edition of the World Energy Investment report, which Carbon Brief has covered in previous years, the IEA has gone beyond its usual remit of reviewing annual trends. 

Its analysis looks ahead to the coming year and estimates the impact of this year’s economic turmoil on energy investment, which was expected to grow by around 2% prior to Covid-19. It is now expected to drop by 20%, or almost $400bn.

Meanwhile, as demand and prices collapse, consumer spending on oil is expected to drop by more than $1tn, prompting a “historic switch” as spending on electricity exceeds oil for the first time.

Here, Carbon Brief has picked out some key charts to illustrate the economic repercussions of the pandemic across the energy sector.

Energy investment will drop by a fifth

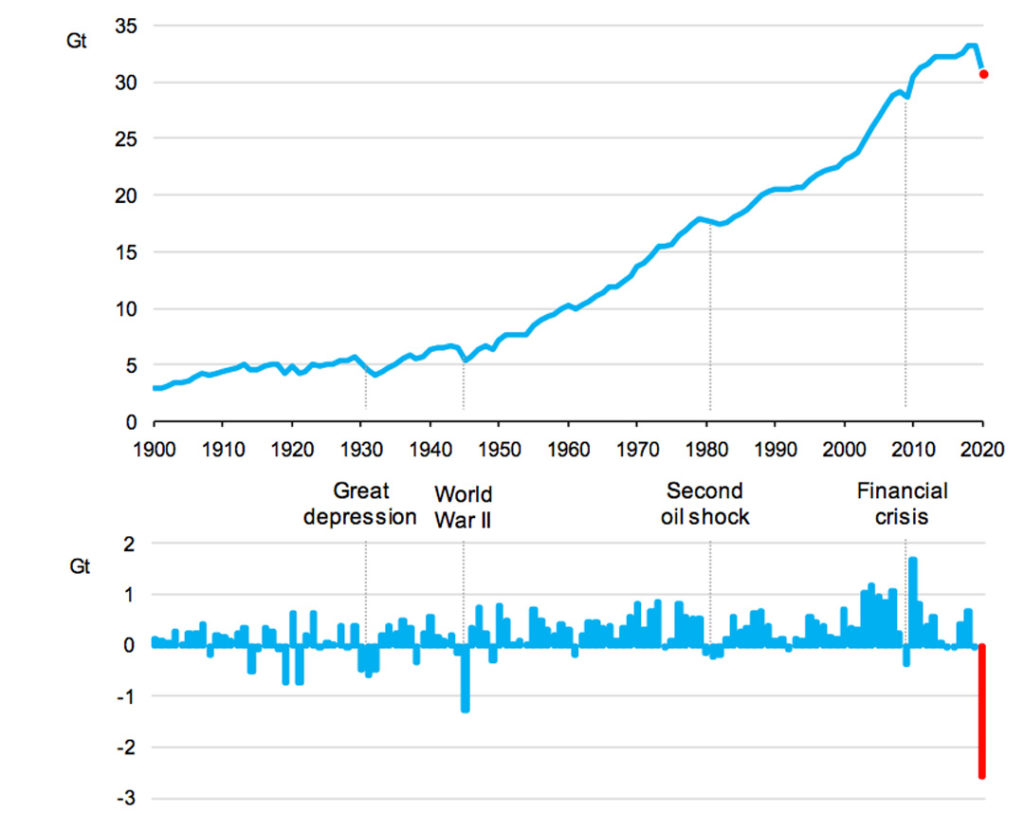
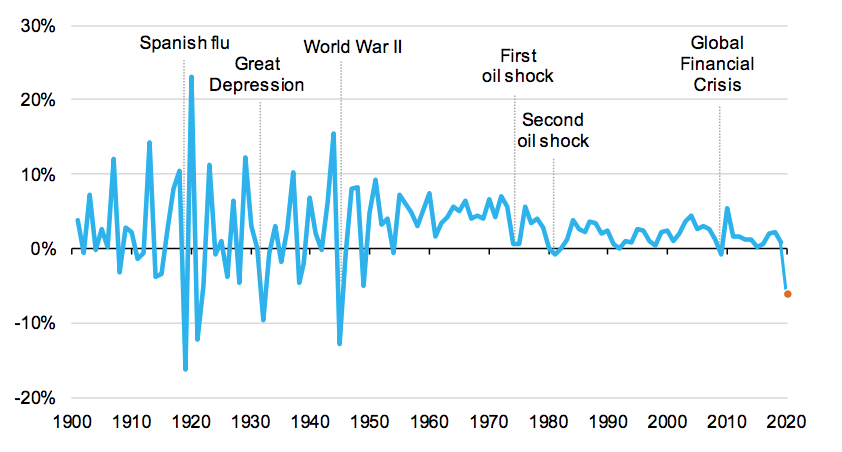
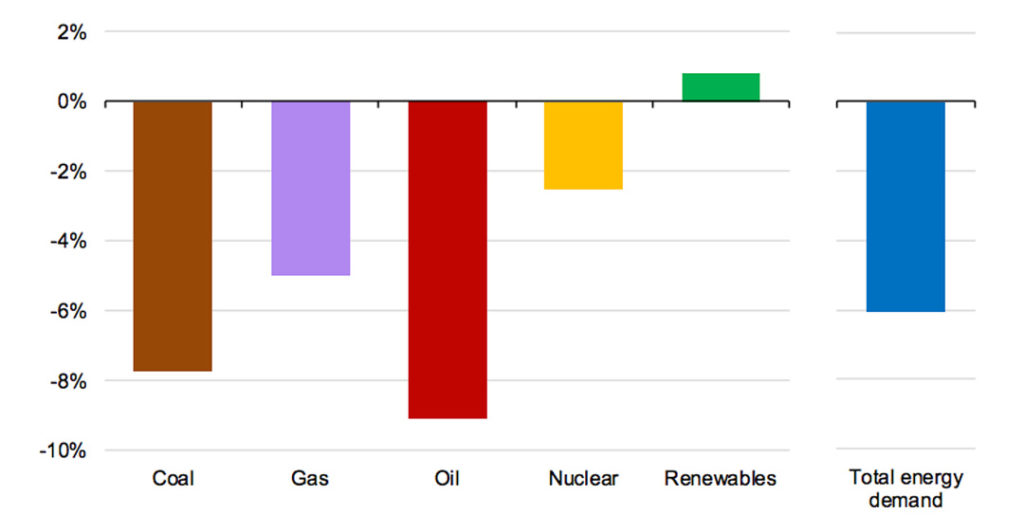
The “baseline expectation” for 2020 is a global recession resulting from widespread lockdowns, according to the IEA. Last month, the agency estimated this will also lead to CO2 emissions dropping by 8% this year in the largest decline ever recorded.

Based on the latest investment data and project information, announcements from companies and governments, interviews with industry figures and its own analysis, the IEA concludes such a recession will see energy investment drop by a fifth. This can be seen in the chart below.

Energy investment is set to fall by a fifth in 2020 due to the coronavirus pandemic. Fuel supply (red) includes all investments associated with the production and provision of fuels to consumers, consisting mainly of oil, gas and coal investments. Power sector (blue) includes spending on power-generation technologies, grids and storage. Energy end use and efficiency (yellow) includes the investment in efficiency improvements across all end-use sectors. Source: IEA

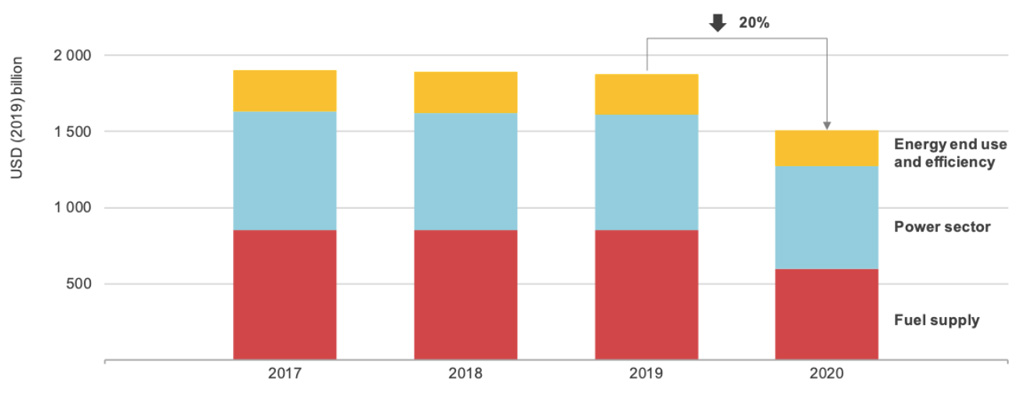
These estimates are based on assumptions about the duration of lockdowns and coronavirus recovery trajectories.

The IEA notes that “almost all” investment activity has been disrupted by these measures, as a result of restrictions to the movement of people, goods and equipment. 

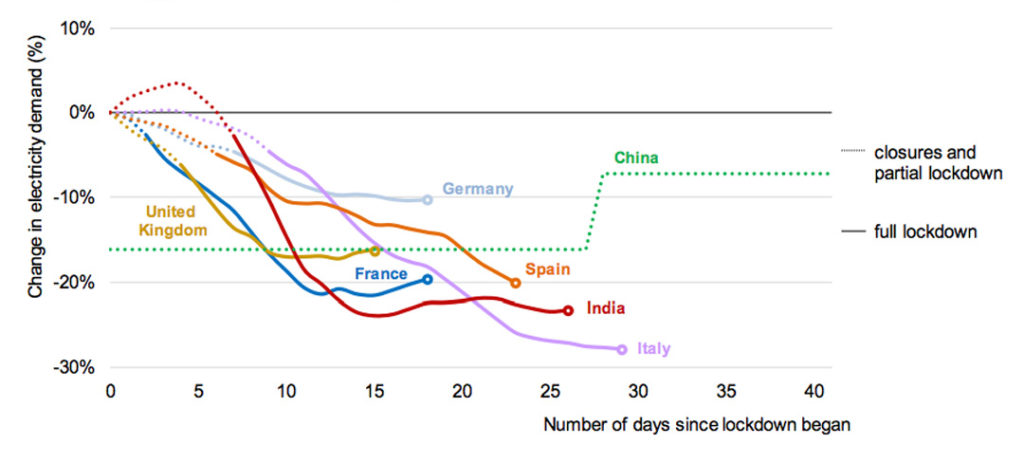
However, the largest impacts are the result of declines in revenues due to falling demand and prices, with the clearest example coming from the oil sector. Analysis of daily data until mid-April suggests countries in full lockdown have seen energy demand drop by a quarter.

As a result, the agency also estimates that these factors, combined with a rise in cases of people not paying their energy bills, will see revenues going to both governments and industry fall by over $1tn this year.

Crisis ‘accelerating’ shift from low-efficiency technologies

Every year energy infrastructure is retired and replaced with new equipment. Typically, the replacement technologies will be cleaner and more efficient, although this is not always the case. 

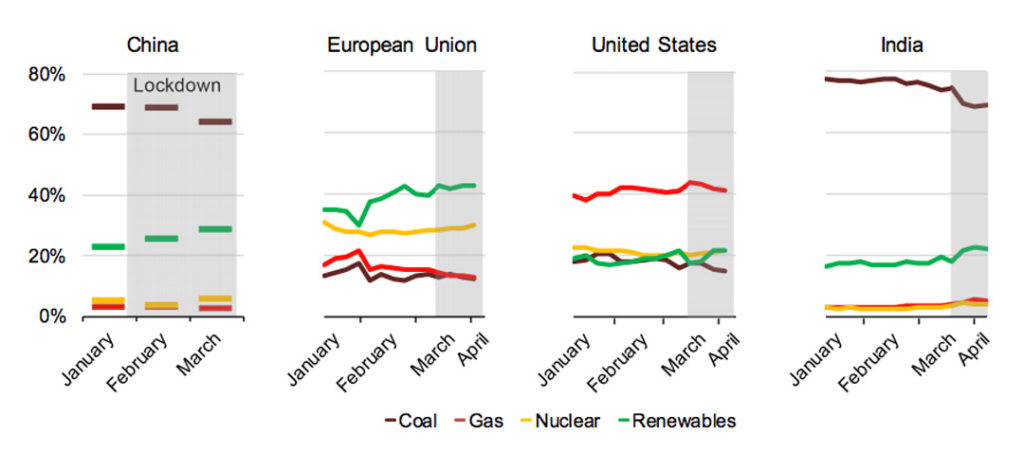
The coronavirus crisis is expected to have an impact on this rate of turnover and, indeed, it is already contributing to the retirement of some older power plants and facilities, as the chart below illustrates.

The Covid-19 crisis is hastening the retirement (light blue) of some older plants and facilities, but also impacting consumer spending on new and more efficient technologies (dark blue), with the potential for a net decrease (yellow dot) in upstream oil-and-gas facilities. Source: IEA.

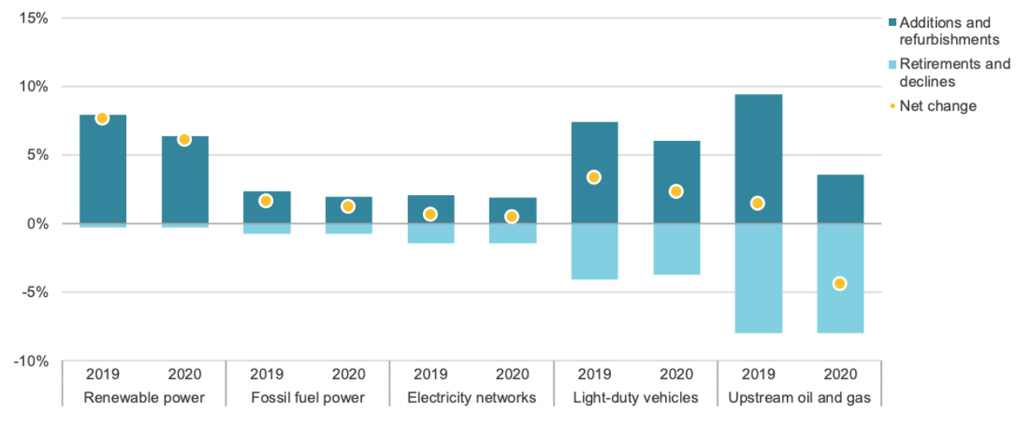
The economic downturn and “surfeit of productive capacity in some areas” as overall demand plummets is already “accelerating” the closure and idling or inefficient technologies, including refineries and some coal-fired power plants.

However, the IEA warns that equally governments might respond to the pandemic by underinvesting in new technologies and remaining reliant on inefficient, older technology. The agency estimates efficiency investment could drop by 10-15% as spending is cut back.

The report warns that policymakers should keep these elements in mind and “combine economic recovery with energy and climate goals”. Dr Fatih Birol, executive director of the IEA, said in a statement that while the pandemic has brought lower emissions it has been “for all the wrong reasons”:

“The response of policymakers – and the extent to which energy and sustainability concerns are integrated into their recovery strategies – will be critical.”

Clean energy spending ‘relatively resilient’

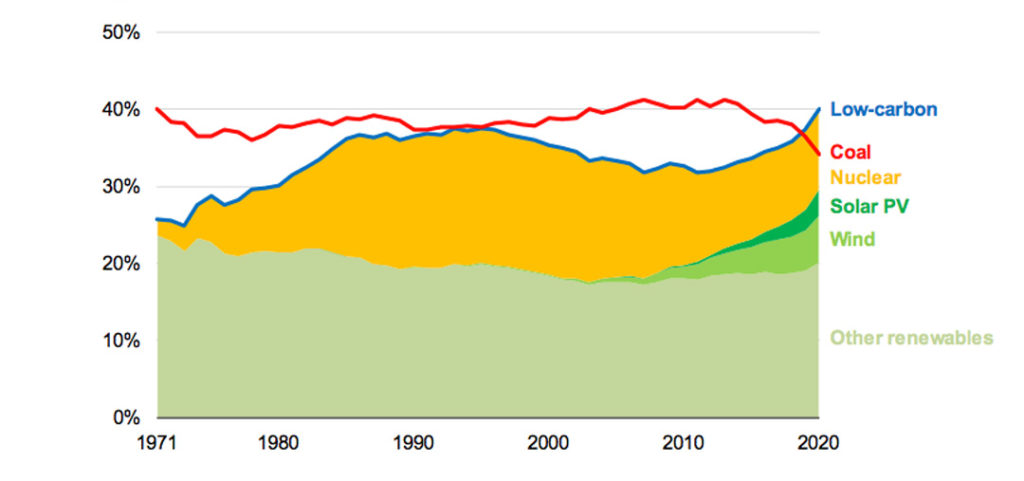
The share of global energy spending going towards clean energy, including renewables as well as nuclear and efficiency improvements, has been flat-lining at around one-third for the past few years.

As the chart below shows, this is likely to change this year as clean energy’s share edges closer to two-fifths of overall spending.

Breakdown of clean energy investment by sector in USD (left x-axis), with the % overall share (right x-axis) of spending indicated by a grey line. Source: IEA.

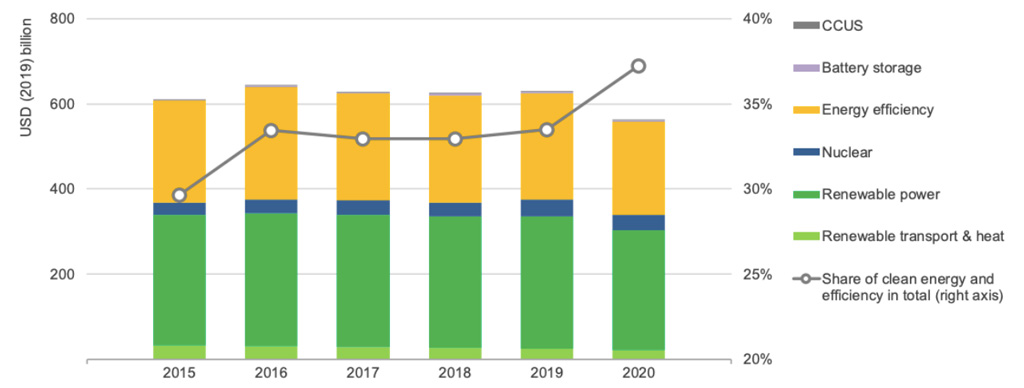
Clean energy investment is expected to remain “relatively resilient” this year, with spending on renewable projects falling by a comparatively small 10%. 

However, according to the IEA, the main reason for clean energy increasing its share is that fossil fuels are set to take such a “heavy hit”. In absolute terms, spending on these technologies is “far below levels” required to accelerate energy transitions.

The agency notes that investment trends have long been “poorly aligned” with the world’s needs and are still set to fall short of the future it has outlined in its benchmark Sustainable Development Scenario (SDS).

Last year’s edition of the World Energy Investment report concluded that investment in low-carbon energy sources must more than double by 2030 if the world is to meet its Paris Agreement targets.

While the slowdown in clean energy spending is less significant, it still “risks undermining the much-needed transition to more resilient and sustainable energy systems,” according to Birol.

Power sector hit hard

International power investment is set to drop by 10% as a result of the Covid-19 pandemic, according to the agency. 

Virtually every component of the sector is expected to see a decline in investment, with hydro the only exception, as the chart below demonstrates.

Global investment in the power sector by technology, with figures from the previous three years and estimates for 2020 (yellow). Source: IEA.

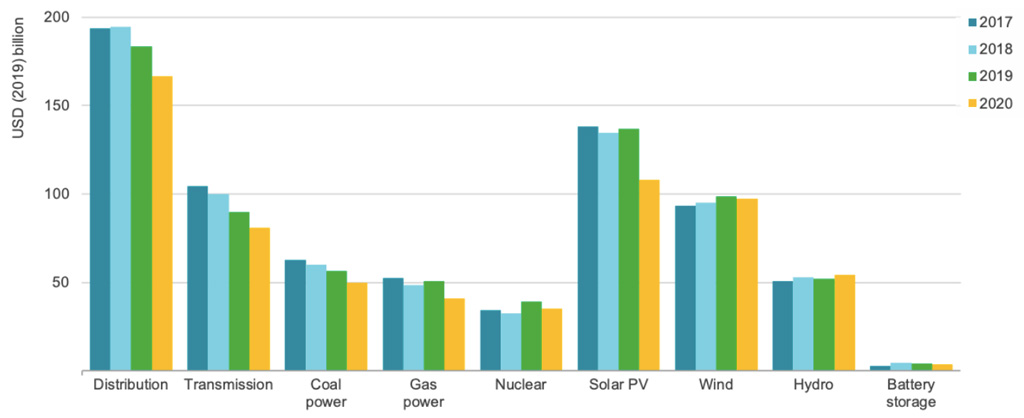
Increases in residential electricity demand around the world during lockdown are being “far outweighed” by reductions in commercial and industrial operations, the agency reports. A 9% decline in spending on electricity networks this year is also expected.

The IEA says some parts of power investment are more exposed, specifically fossil fuel-based generation. 

Meanwhile, higher shares of renewables are being dispatched due to low operating costs and priority access to networks. Nevertheless, renewables are still taking a hit, particularly distributed solar photovoltaics (PV) as households and companies cut back on spending.

Technologies with a longer lead time, notably offshore wind and hydropower, are expected to do better despite some delays.

Electricity spending pulls ahead of oil

Oil accounts for most of the decline in revenues expected this year. Furthermore, in a “historic switch” consumer spending on electricity could exceed spending on oil for the first time ever. 

While power-sector revenues are expected to fall by $180bn, oil spending will likely drop by at least $1tn. This can be seen in the chart on the left below. Taken together, investment in oil and gas is expected to fall by almost a third in 2020. 

Both global end-use spending by consumers on energy (left) and estimated 2020 investment compared to 2019 show oil is expected to see the biggest decline in investment activity this year. Source: IEA.

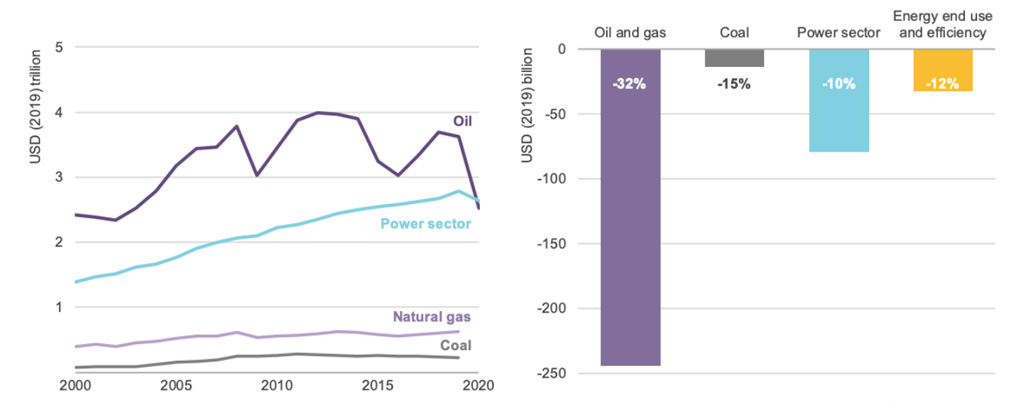
The decline in aviation and road transport, which represent nearly 60% of oil demand, are responsible for this disproportionate decline.

Meanwhile, the impact on gas has so far been more moderate, but could fall further due to reduced demand in power and industry settings.

The report also highlights the global shale sector, which was already under pressure, as being particularly vulnerable. 

With investor confidence and access to capital in decline, the IEA predicts shale investment will halve in 2020 and notes the outlook for “highly leveraged shale players in the US” is now “bleak”.

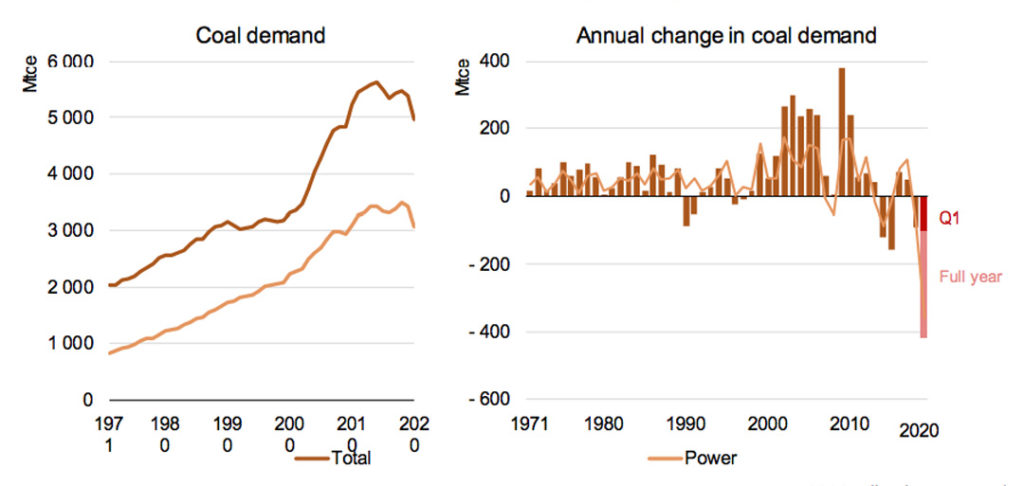
Coal decline given a ‘floor’ by China

Coal is estimated to be the fuel hardest hit by the crisis after oil. Coal demand could drop by 8% this year, investment in coal supply is set to fall by a quarter and spending on new coal-fired plants is set to fall by around 11%.

However, any decline in coal’s fortunes may be curtailed by the recovery of demand for the fossil fuel in China. According to the IEA, investment activity there “may put a floor” under further reductions in coal-power investment this year.

The nation’s focus on coal is illustrated in the chart below, which shows final investment decisions (FIDs) dropping to their lowest levels in a decade, but China providing virtually all of them in the year so far.

Coal-fired power generation capacity (GW) subject to a final investment decision (FID), with China coloured in green. Source: IEA.

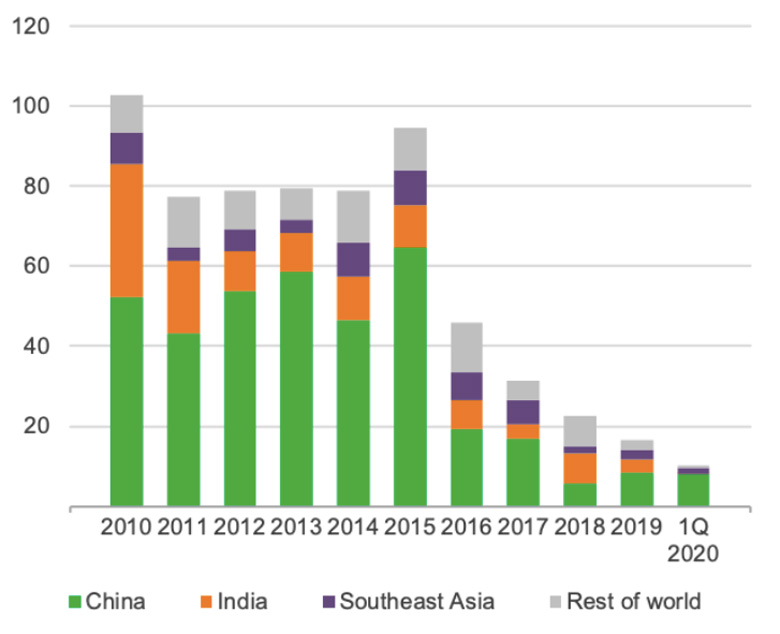
Using data available so far, the IEA notes that approvals for new coal plants in the first quarter of 2020, were “running at twice the rate observed over 2019 as a whole”, primarily in China.

Electric vehicle sales rising as overall market contracts

Last year was a difficult time for the car industry, with total sales growth slowing in all major regions and turning negative in China and the US.

However, this “turbulent” period for the industry is “likely to appear mild” in comparison with 2020, according to the IEA. 

Lockdowns have already severely impacted sales and, across the year, the agency estimates a drop of around 15% – dramatic even compared to the 10% drop that followed the 2008 financial crisis. Negative trends in overall car sales can be seen in the right-hand chart below.

Global sales of electric passenger vehicles – cars, vans and small trucks – and market share, indicated by a red line (left chart). Total light-duty vehicle sales (right). Source: IEA.

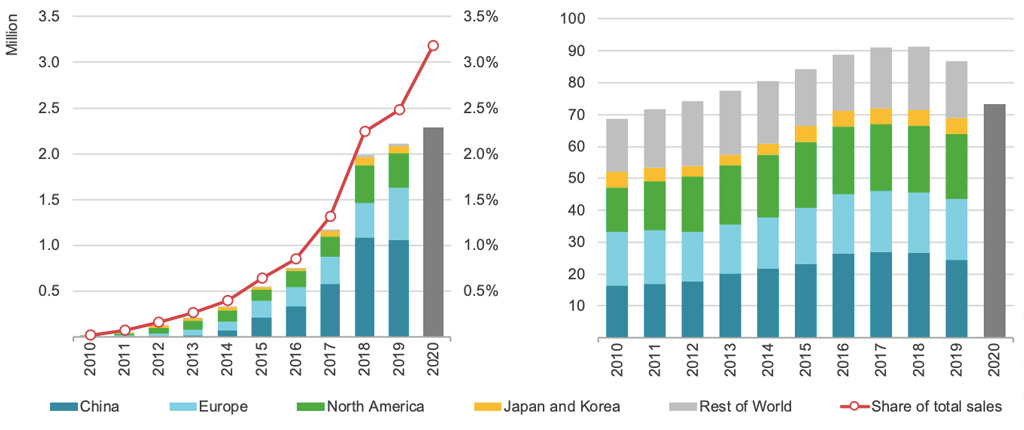
However, even though electric vehicle sales followed wider patterns and stalled in 2019 largely due to declining Chinese purchases, their overall market share continued to climb. 

This can be seen in the chart on the left, which shows that electric cars are expected to go against the broader trend in 2020. The IEA estimates that owing to policy support, particularly in Europe, electric vehicle sales will increase this year, as will their share of the market (indicated by the red line).

Battery storage spending fell as prices dropped

Investment in battery storage fell for the first time last year, as the chart below shows. Overall, spending on grid-scale and behind-the-meter batteries fell by 15%, with overall investment just above $4bn.

Investment in both grid-scale (left) and behind-the-meter battery storage (right). Source: IEA.

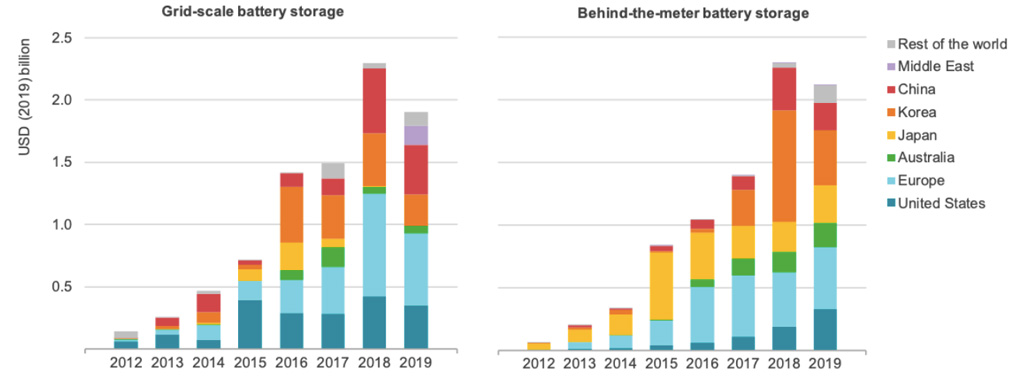
The IEA states this decline took place as costs for battery storage fell rapidly, a trend the agency attributes to maturing supply chains and markets, more efficient production and competition within the sector.

The report mentions fires at energy storage installations in South Korea and regulation uncertainty in China as some of the factors behind the decline in interest last year.

Declining behind-the-meter battery spending also reflects the distributed solar PV market, for which investment slowed last year in a trend expected to continue as consumer spending drops off due to coronavirus.

The agency notes that grid-scale battery investments are also expected to decline this year against the backdrop of a general decrease in power activity. 

However, it says this setback “is likely to be shortlived” due to the technology’s growing importance for system security and flexibility. 

***

IEA: Coronavirus ‘accelerating closure’ of ageing fossil-fuelled power plants

Josh Gabbatiss, Carbon Brief, 27 May 2020

Published under a CC license. Carbon Brief welcomes the reproduction of unadapted material in full for non-commercial use, credited ‘Carbon Brief’ with a link to the article.

Q&A: Could climate change and biodiversity loss raise the risk of pandemics?

Q&A: Could climate change and biodiversity loss raise the risk of pandemics?

Daisy Dunne, Carbon Brief, 15 May 2020

***

Across the world, millions of people have tested positive for Covid-19 – and countless more have seen their lifestyles completely transformed as a result of the virus.

It is not yet known exactly what triggered the current outbreak, but researchers suspect that the virus passed from bats to humans through an unknown intermediary animal, possibly a pangolin.

Politicians in the UK have called this pandemic a “once-in-a-century” crisis. But scientists have warned that the ongoing disturbance of species through human activities and climate change could be raising the risk of potentially pandemic-causing diseases passing from animals to humans.

The study of the “spillover” of disease from animals to humans has received renewed focus in light of the pandemic. The Intergovernmental Panel on Climate Change (IPCC) – a major international collaboration of climate scientists – is now looking into how the influence of warming on such events could be included in its next major climate report due next year.

In this explainer, Carbon Brief examines what is known about how climate change and biodiversity disturbance, including habitat loss and human-animal conflict, could influence the risk of diseases being transmitted from animals to humans.

How does an animal-to-human disease spillover turn to a pandemic?

When humans come into contact with other animals, they can pass harmful pathogens between one another. The passing of an infection or disease from a vertebrate animal to a human is known as a “zoonosis”, according to the World Health Organisation (WHO). (Vertebrate animals include mammals, birds and reptiles, but not insects, such as mosquitoes.)

Such diseases have a major impact on health, accounting for two-thirds of all human infectious diseases and three out of four newly emerging diseases.

Serious diseases that have spilled over from animals to humans include Ebola in Africa, Marburg in Europe (and subsequently in Africa),  Hendra virus in Australia and severe acute respiratory syndrome (SARS) coronavirus and Nipah virus in east Asia. Some have gone on to have a lasting, global impact, such as HIV/AIDS and swine flu (H1N1). The current Covid-19 pandemic was also most likely caused by a spillover.

The number of potentially harmful viruses circulating in mammal and bird populations that have not yet spilled over to humans is estimated to be up to 1.7m, according to the Intergovernmental Science-Policy Platform on Biodiversity and Ecosystem Services (IPBES). (IPBES is an independent group of international researchers monitoring biodiversity issues).

The spillover of disease from animals to people can happen in many ways, including directly through animal bites, the consumption of raw or undercooked animal meat or products such as milk, or through contaminated water. Diseases can also spread indirectly if humans come into contact with a surface that has been contaminated by an infected animal. Both wild animals and livestock can pass on disease.

A mouse opossum (Marmosa sp.) raids the trash in Peru. Credit: Anton Sorokin / Alamy Stock Photo

(Sometimes, transmission occurs through an intermediary species that can carry the disease without getting sick. Scientists suspect this is how the Covid-19 pandemic started.)

Out in the wild and in settings where humans and animals come into contact, these kinds of interactions happen regularly – and it is rare for one to end with a human being infected by a new disease, explains Dr David Redding, a research fellow at the Zoological Society of London. He tells Carbon Brief:

“There are lots of different factors that need to all overlap at the same time for there to be a contact that is both effective in terms of transferring a live pathogenic organism and then also for that very rare situation where that pathogen has an adaptation that allows it to invade our immune system.”

Even if a disease is effectively transmitted from an animal to a person, it is unlikely that they will then pass it on to someone else, he adds:

“I would say most – possibly 99% – of all diseases that are caused in that way can’t then be passed on. So we’ve got another ‘filter’ that dictates that people have to be infected in a particular way that allows them to shed viruses effectively to other people.”

This “virus shedding” can happen in various ways. Like other respiratory diseases, Covid-19 can be transmitted when a carrier coughs or sneezes in close proximity to another person. (Scientists are still debating whether the virus can also be passed on in other ways.)

The ability of the new pathogen to spread directly from person to person is a key ingredient for a disease to take hold in a population, Redding says. (Some animal-borne diseases require a vector to spread from person to person, such as West Nile virus and Lyme disease.)

An illness outbreak is said to become an “epidemic” when its impact on people in a single community or region is “clearly in excess of normal expectancy”, according to the WHO. The term “pandemic” describes the worldwide spread of a new disease. (When a disease is “endemic” it has a continuous presence in a population or area.) 

Since 1900, there have been pandemics at “intervals of several decades”, according to the WHO. The worst in this time period was Spanish flu, which killed an estimated 50 million people from 1918-19.

A group of people standing outdoors wearing masks over their mouths, probably taken during the Spanish Flu epidemic of 1918. Credit: Niday Picture Library / Alamy Stock Photo

Prior to Covid-19, every outbreak considered to be a pandemic by the WHO since 1900 has been caused by influenza, a virus that transmits from person to person. Some new strains of flu originate in animals, such as bird flu, but most new strains arise in human populations – and so would not be considered animal-borne.

There are many factors that can determine whether an outbreak reaches epidemic or pandemic status. These include human factors, such as preparedness and early action to prevent the illness from spreading, and also the traits of the pathogen itself, says Redding:

“The characteristics of the pathogen and its ability to spread are two key components in causing these rare events.”

For instance, if the pathogen causes very severe illness, the sufferer is less likely to be able to travel to a new place to pass on the disease, Redding says. This is also the case if the mortality rate is particularly high.

In contrast, if the disease causes mild to undetectable symptoms for at least some sufferers – as is the case with Covid-19 – it is more likely that people will inadvertently spread it to new places, he says.

This may go some way to explaining why previous serious animal-borne disease outbreaks have not reached pandemic status, Redding explains.

Members of a burial team prepare for a burial in Komende Luyama village. Eastern Sierra Leone was a hot spot for Ebola for several months, but eventually authorities managed to bring down infection rates to just a few cases per week. 17 October 2014 Credit: Tommy E Trenchard / Alamy Stock Photo

For example, Ebola – a disease initially spread to humans by fruit bats – has caused several serious epidemics in West Africa, but has not established itself on a worldwide scale. It has a mortality rate of around 50%. The mortality rate of Covid-19 is not yet known, though it is likely to be below 10%.

It is also worth noting that the likelihood of a disease turning to a pandemic has been heightened in recent decades by increased global connectivity, particularly through frequent air travel, Redding says:

“Plagues in the medieval times took years to spread across Asia. Whereas we look at today’s outbreaks and we can see that they can spread in hours.”

Overall, for a spillover event to turn into a pandemic, there must be a “perfect storm” of several complex factors all occurring at the same time – which, at present, does not happen very often, says Redding: “I think history shows us that these sort of large outbreaks happen a couple of times a century.”

Could climate change and biodiversity disturbance affect the risk of spillover?

Every new animal-borne disease starts with humans coming into contact with wildlife. And it is likely that climate change and the disturbance of biodiversity could play a role in shaping the frequency, timing and location of these meetings, says Prof Hans-Otto Poertner, head of biosciences at the Alfred Wegener Institute (AWI) and co-chair of the impacts chapter of the next major assessment report from the IPCC. He tells Carbon Brief:

“Climate change is clearly a factor that can influence these relationships. Climate change shapes the biogeographical distribution of species. If, in the future, we see species moving into areas where humans are prevalent, we could see new opportunities for pandemics to evolve.”

Research has shown that climate change is shifting where species live, both on land and in the ocean. This is because, as temperatures increase and rainfall levels change, some species are being forced to seek out new areas with climate conditions they are able to tolerate. (Species that are not able to adapt could face extinction.)

A review published in Science in 2017 looking into 40,000 species across the world found that around half are already on the move as a result of changing climate conditions.

In general, species are seeking cooler temperatures by moving towards the Earth’s poles. Land animals are moving polewards at an average rate of 10 miles per decade, whereas marine species are moving at a rate of 45 miles per decade, according to the review.

Dugong feeding in the seagrass bed, Dimakya Island, Palawan, Philippines. Credit: Nature Picture Library / Alamy Stock Photo

However, the movement of animals is complicated by other factors, such as the changing availability of food, the shifting distribution of predators and changing patterns of human land-use, the review says. This makes it difficult to predict exactly where species will move to.

It is likely that the movement of species will have consequences for human health, says Prof Birgitta Evengard, a senior researcher of infectious diseases at Umea University in Sweden, who was one of the authors of the review. She tells Carbon Brief:

“When land-based animals move, they bring with them their [viruses] – and they will spread them.” 

So far, there has not been a great deal of research into how climate change-driven shifts to animal ranges could affect the chances of disease spillover on a global scale, says Poertner.

In one example, a research paper by Redding found that climate change could heighten the risk of new Ebola outbreaks in various parts of Africa by 2070.

This is because climate change could cause regions that are currently desert to become warmer and wetter, leading to the formation of the lush plants that bats use as a habitat. The movement of bats into these new areas could increase contact between them and humans, increasing the chances of disease spillover, the study found.

A fruit bat (flying fox) in Tissamaharama, Sri Lanka. Credit: paul kennedy / Alamy Stock Photo

Another study found that climate change could enhance the risk of spillover of the Hendra virus, an animal-borne disease that can pass from flying foxes to humans through horses, which are also affected by the virus.

The virus was first identified when an outbreak broke out in Hendra, a suburb in Brisbane, Australia, in 1994. Since then, there have been at least eight separate outbreaks along the coast of northern Australia, according to the WHO. It has a mortality rate of 50-75%.

Recorded Hendra virus outbreaks in Australia. Source: WHO

The research found that climate change could cause the geographic range of flying foxes to expand southwards and further inland. “Spillover events could potentially increase farther south, and inland with climate change,” the authors say.

Elsewhere, a recent preprint – a preliminary study that has not yet completed peer review – suggests that climate change could drive substantial global increases in the passing of novel diseases from mammals to humans by 2070.

Using modelling, the study maps where around 4,000 mammals species and the diseases they carry are likely to move to by 2070. It finds mammals are “predicted to aggregate at high elevations, in biodiversity hotspots, and in areas of high human population density in Asia and Africa, sharing novel viruses between 3,000 and 13,000 times”.

The authors add: “Most projected viral sharing is driven by diverse hyper-reservoirs (rodents and bats) and large-bodied predators (carnivores).”

It will be important for the IPCC to include the emerging evidence of how climate change could affect the passing of diseases from animals to humans in its next major assessment report, currently due for release in 2021-22, says Poertner:

“We expect to include aspects as they become apparent from the literature.”

The scale of the impact of climate change on wildlife is currently second only to the damage caused by human land-use change, including deforestation, other types of habitat loss and human-animal conflict.

In its first major assessment on biodiversity published in May 2019, IPBES reported that humans have “significantly altered” 75% of the land surface and 66% of the global ocean. During 2010-15, 32m hectares of natural or recovering forest were cleared by humans. This area is roughly equal to the size of Italy.

As a result of ongoing pressures on biodiversity, around one million species are currently threatened by extinction within decades, the report concluded.

The report noted that ongoing pressures on wildlife are likely to increase contact between animals and humans, altering the chances of disease spillover. In chapter three of the full report, the authors say:

“Complex links between increased human disturbance, land-use change, habitat loss/degradation and biodiversity loss have all been linked to increases in the prevalence and risk of zoonotic [animal-borne] disease for a variety of pathogens.”

However, research into how biodiversity disturbance could affect animal-borne disease risk at a global level has so far been limited, it notes:

“Causal mechanisms are only well known for a handful of infectious diseases and it is sometimes hard to pick apart the drivers of disease to isolate the direct effects of environmental change from other human actions.”

Research has shown that bushmeat huntingdeforestation and the trade of wildlife at markets can heighten the risk of diseases passing between animals and humans.

In 2018, a study warned of a possible link between deforestation in southeast Asia and a heightened risk of spillover of novel coronaviruses from bats to humans. The authors say:

“Owing to evolving land-use, bat populations are setting up in areas closer to human dwellings…This increases the risk of transmission of viruses through direct contact, domestic animal infection, or contamination by urine or faeces.”

***

Q&A: Could climate change and biodiversity loss raise the risk of pandemics?

Daisy Dunne, Carbon Brief, 15 May 2020

Published under a CC license. You are welcome to reproduce unadapted material in full for non-commercial use, credited ‘Carbon Brief’ with a link to the article. 

inflection point? · oil major tears up the industry’s financial playbook

In August 2014 Simon Evans of Carbon Brief, reporting on a white paper, “Fossil fuel divestment: a $5 trillion challenge,” published days earlier by Bloomberg New Energy Finance, noted that “‘fossil fuels are investor favourites for a reason’….fossil fuel investments have a history of strong performance.

BNEF looked at seven alternative trillion-dollar sectors and found that only shares in real estate firms have paid higher dividends in recent years than fossil fuel firms.”

(Simon Evans, “Why fossil fuel divestment won’t be easy,” Carbon Brief, 27 August 2014)

Fast forward to today. Due to the impact of the Covid-19 pandemic, global energy demand in the first quarter of 2020 was 3.8% lower than in the same quarter of 2019. The IEA expects global energy demand for 2020 to decline by 6% year-on-year, a decline not seen for decades.

Annual rate of change in primary energy demand, %, since 1900, with key events impacting demand highlighted. Source: Josh Gabbatiss, “IEA: Coronavirus impact on CO2 emissions six times larger than 2008 financial crisis,” Carbon Brief, 30 April 2020; IEA Global Energy Review

The fossil fuel sector, consistently a source of large dividends over the years, is suddenly under market stress and scrutiny from investors.

While “most analysts expected the world’s largest Western super majors … to defend their dividend at almost any cost given how important the payouts are to North American investors” (Kevin Crowley, Exxon Freezes Dividend for First Time in 13 years Amid Crash, Bloomberg, 29 April 2020), Royal Dutch Shell, Europe’s largest oil company, shocked the investing world.

Shell both reduced its dividend, the first time it has done so since World War II, for Q1 2020 and, observing that it would be neither “wise” nor “prudent” nor “responsible” to do so, announced it will not follow industry practice of borrowing against its balance sheet to finance the dividend payment.

The Board of Royal Dutch Shell plc (“RDS” or the “Company”) today announced an interim dividend in respect of the first quarter of 2020 of US$ 0.16 per A ordinary share (“A Share”) and B ordinary share (“B Share”), reduced from the US$ 0.47 dividend for the same quarter last year.

The pace and scale of the societal impact of COVID 19 and the resulting deterioration in the macroeconomic and commodity price outlook is unprecedented. The duration of these impacts remains unclear with the expectation that the weaker conditions will likely extend beyond 2020.

“In response, Shell has taken decisive actions to reduce our spending and position our businesses to compete in the current lower commodity price environment and uncertain demand outlook.

“The Board of Royal Dutch Shell has taken the decision to reset its dividend to provide financial resilience and further flexibility to manage the uncertainty. Shell is taking the steps necessary to ensure that we are well-positioned for the eventual economic recovery.

(“Royal Dutch Shell plc first quarter 2020 interim dividend,” 30 April 2020)

Not only did the dividend reduction, coupled with CEO Ben van Beurden’s further announcement that Shell would not take on debt to fund its dividend payment, shock investors, it also “tore up the industry’s playbook.”

When the boss of Royal Dutch Shell Plc slashed his dividend on Thursday, he didn’t just shock investors,” Laura Hurst of Bloomberg commented, “he tore up the industry’s financial playbook.

For decades Big Oil has used the strength of a large balance sheet to borrow money when the going gets tough and keeps investors sweet until the next upward cycle.

As the coronavirus pandemic potentially causes lasting damage to energy demand, Europe’s largest oil company asked whether this strategy is sustainable.

“’I would say no,’ said Shell Chief Executive Officer Ben van Beurden. ‘It’s also not wise and prudent, nor even responsible, to pay out a dividend if you know for sure you have to borrow for it.‘”

(Laura Hurst, “Shell’s Dividend Cut Shows This Time is Different for Big Oil,” Bloomberg, 30 April 2020)

Norwegian multinational energy company Equinor (OSE:EQNR,NYSE:EQNR; formerly Statoil) announced on 23 April a cash dividend of US$ 0.09 per share for the first quarter 2020, a reduction of 67% compared to the dividend proposed for the fourth quarter 2019.  

On 28 April, BP announced an interim dividend of 10.50 cents per ordinary share for the first quarter of 2020.

Gaurav Sharma, Senior Contributor at Forbes, observing that whilst first quarter profits at BP have decreased by 67% on lack of oil demand and the crude oil price crash, the company “sprung a surprise for the market by maintaining the company’s 10.5 U.S. cents per share dividend payment, hiked by 2.4% as recently as February.”

The move,” Mr. Sharma noted, “will come as a relief to beleaguered U.K. income funds that have seen over $18.6 billion in payouts cancelled or suspended over the last six weeks.

Collectively, HSBC, GSK, Royal Dutch Shell, British American Tobacco and BP accounted for 40% of FTSE 100 dividend payouts in 2019. With BP promising to payout, HSBC holding back following regulatory pressure, GSK, BAT and Shell, which hasn’t failed to pay a dividend since the Second World War II, appear to be in the bag.”

(Gaurav Sharma, “Profits Slump 67% At BP But Oil Major Maintains Dividend Despite Coronavirus Downturn,” Forbes, 28 April 2020)

On 29 April, Exxon Mobil Corp., based in Irving, Texas and the largest oil company in the Western Hemisphere, announced that for the second quarter 2020 it will pay a dividend of 87 cents per share. This is the same amount that was paid per share for the first quarter of 2020.

For the first time in 13 years, ExxonMobil “froze” its second quarter dividend to the amount paid in the first quarter.

Kevin Crowley of Bloomberg notes “Before now, Exxon had an uninterrupted streak of April increases going back to 2007.”

Most analysts expected the world’s largest Western super majors, including Exxon, to defend their dividend at almost any cost given how important the payouts are to North American investors. Before today, Exxon was the third-largest dividend payer in the S&P 500 Index behind Microsoft Corp. and AT&T Inc., according to data compiled by Bloomberg.”

The freeze may not derail Exxon’s multi decade streak of annual increases,” Mr. Crowley continues. “Even if the company maintains quarterly payouts at the current level for the rest of 2020, the annual outlay will be $3.48 a share, or 1.5% above 2019.

“’It’s definitely a sign of the times and to be expected given the price environment,’ said Jennifer Rowland, an analyst at Edward D. Jones &Co. The payout is “secure” because the company has capacity to take on debt to fund it, she said. On an annualized basis, the dividend will cost Exxon almost $15 billion this year.”

(Kevin Crowley, Exxon Freezes Dividend for First Time in 13 years Amid Crash, Bloomberg, 29 April 2020)

See:

Josh Gabbatiss, “IEA: Coronavirus impact on CO2 emissions six times larger than 2008 financial crisis,” Carbon Brief, 30 April 2020

First Quarter 2020 Interim Dividend,” Royal Dutch Shell Plc, 30 April 2020

Laura Hurst, “Shell’s Dividend Cut Shows This Time is Different for Big Oil, ” Bloomberg, 30 April 2020

Dividend Information, ExxonMobil dividends per common share,” Exxon Mobil, 29 April 2020

Kevin Crowley, “Exxon Freezes Dividend for First Time in 13 years Amid Crash,” Bloomberg, 29 April 2020

BPp.l.c. Group results, First quarter 2020“, 28 April 2020

Gaurav Sharma, “Profits Slump 67% At BP But Oil Major Maintains DividendDespite Coronavirus Downturn,” Forbes, 28 April 2020

Equinor reducing quarterly cash dividend for first quarter 2020 by 67%,” Equinor, 23 April 2020

Mikael Holter, “Norway Oil Giant Slashes Dividend to Weather Oil-Market Crash,” Bloomberg, 23 April 2020

Financial Times, “Shell dividend cut puts Big Oil investment case in focus” 

Simon Evans, “Why fossil fuel divestment won’t be easy,” Carbon Brief, 27 August 2014

Nathaniel Bullard, “Fossil fuel divestment: a $5 trillion challenge,” White Paper, Bloomberg New Energy Finance, 25 August 2014

IEA: Coronavirus impact on CO2 emissions six times larger than 2008 financial crisis

IEA: Corona virus impact on CO2 emissions six times larger than 2008 financial crisis

Written by Josh Gabbatiss. Published on Carbon Brief, 30 April 2020.

The world’s CO2 emissions are expected to fall by 8% this year as the coronavirus pandemic shuts down much of the global economy, according to the International Energy Agency (IEA).

Such a drop would be the largest ever recorded in terms of tonnes of CO2, some six times greater than the impact of the 2008 financial crisis.

The agency’s new Global Energy Review is based on extensive data from the year so far and is intended to provide close to a real-time estimate of energy usage and emissions.

Its projections for the whole of 2020 are based on a series of assumptions including that the lockdowns, curfews and closure of schools and businesses currently in place are gradually eased over the coming months.

However, as the pandemic spreads and its devastating impacts continue to unfold, the agency makes clear that there are still “major uncertainties” about how it will play out.

The IEA’s central figure of 8% is even higher than previous estimates, including analysis conducted by Carbon Brief and published earlier this month, which was based on a less comprehensive dataset and less recent data.

An 8% cut is roughly equivalent to the annual emissions reductions needed to limit warming to less than 1.5C above pre-industrial temperatures. However, the stretch target laid out in the Paris Agreement would require similar reductions every year this decade.

The agency is clear that the expected decline in emissions due to a pandemic is “absolutely nothing to cheer”. Moreover, it emphasises the importance of prioritising clean energy in economic recovery plans in order to avoid a sharp rebound in emissions.

Unprecedented shock

Describing the pandemic as a “a macroeconomic shock that is unprecedented in peacetime”, the IEA draws comparisons with the impact that wars and other recent crises have had on the global energy system. Some of these events can be seen in the figure below.

The report compares the covid-19 pandemic with the last financial crisis, when growth in China and India “was able to largely offset reductions elsewhere”. This time around, both nations are also feeling the effects of the disease and such an offset is unlikely.

Global energy-related emissions (top) and annual change (bottom) in GtCO2, with projected 2020 levels highlighted in red. Other major events are indicated to a give a sense of scale. Source: IEA Global Energy Review.

As it spreads to virtually every nation on the planet, the impact of coronavirus is being felt in all walks of life, but different sectors are being affected in very different ways.

Energy use for residential gas heating or electricity use for server farms and digital equipment may even show a significant increase in the coming months, the IEA says, whereas other sectors such as aviation have collapsed.

Global energy demand was 3.8% lower in the first quarter of 2020 than last year, the IEA says, and it expects the annual total to drop by 6% year-on-year in 2020. 

Such a decline has not been seen for decades, as the chart below shows, and will effectively wipe out five years of demand growth.

Annual rate of change in primary energy demand, %, since 1900, with key events impacting demand highlighted. Source: IEA Global Energy Review.

CO2 emissions are expected to fall to 30.6bn tonnes of CO2 (GtCO2) this year, an 8% drop from last year, with declining coal use the most significant factor.

The drop in coal combustion is being driven mainly by the power sector, the IEA says, together with competition from cheap natural gas and industrial slowdown. Coal demand is expected to fall 8%, but as China’s industrial sector starts up again, it is expected to go some way to offsetting larger declines.

Demand (left) and annual change in demand (right) for the total quantity of coal used globally (dark) and coal in the power sector alone (light), measured in million tonnes of coal equivalent (Mtce). The change in demand for the first quarter of 2020 (Q1) is shown in red while the projection for the full year is shown in pink. Source: IEA Global Energy Review

Due to the global lockdown’s impact on transport, illustrated in the charts below, demand for oil has fallen at an “unprecedented scale” in the first four months of the year.

Change in road transport activity and flight numbers as a % in 2020 so far compared to the previous year, for selected countries (solid lines) and the whole world (dashed line). Source: IEA Global Energy Review

This is particularly true for fuels used in passenger transport, namely petrol and kerosene. Meanwhile demand for diesel, a substantial portion of which is used to power vehicles that transport goods, is expected to remain stronger. Overall, oil demand is expected to drop by 9% across the year after a 29% drop in the month of April.

As a side-effect of declining transport activity, car sales are expected to decline. In March, EU sales were 55% lower than 2019 levels, and if this trend plays out in nations with fuel economy standards in place, improvements in energy efficiency will be slower, the IEA notes.

Gas demand is expected to fall less than oil or coal as it is less vulnerable to changes in transportation demand, although the IEA says it could still fall by 5%. Gas will be particularly susceptible if countries in the Middle East and North Africa enter long lockdowns, the agency says, due to their reliance on the fuel for power.

In general, nuclear power is expected to fare better than fossil fuels, with lockdowns expected to reduce global output by 3% due to falling demand and disrupted construction. Already, delays have been announced to projects in China and Finland, and more are expected in the UK, US and France.

As the figure below shows, lockdowns in recent months have pushed down electricity demand significantly, with the strongest impacts found in nations with service-based economies and the strictest lockdowns, such as Italy.

Weather-corrected change in electricity demand, %, in selected countries implementing full (solid lines) or partial lockdowns (dashed lines), by number of days since their lockdowns began. Source: IEA Global Energy Review

It is worth noting that as pointed out in Carbon Brief’s recent analysis, it is difficult to assign effects specifically to coronavirus as many other factors will influence energy demand and emissions over the course of the year.

As an example, the IEA points to “milder than average” weather throughout most of the northern hemisphere in the first quarter of the year, which played a part in pushing down energy demand due to less gas being used for heating.

Renewables ascend

As fossil fuel use sank in the first few months of 2020, renewables remained stable, as in general they are given priority access to electricity grids and are not required to adjust their output based on demand. 

Combined with rising capacity as new wind and solar facilities are built, this means that renewable electricity generation rose by almost 3% in the first quarter of the year.

As a result, renewables achieved record-high hourly shares in Belgium, Italy, Germany, Hungary and parts of the US. Analysis just published by Carbon Brief shows a similar trend, with wind and solar reaching a record-high share of generation across Europe over the past 30 days.

These records reflect a rising renewable share of the electricity mix of countries around the world – where demand has declined during lockdowns – as shown in the chart, below.

Changes in the electricity mixes of key emitters in 2020 so far, with the implementation of lockdown strategies indicated by grey shading. Source: IEAGlobal Energy Review

In fact, renewables are also the only energy sources expected to grow this year “regardless of the length of lockdown or strength of recovery”, the report states. This can be seen in the figure below.

Projected % change in primary energy demand by fuel type in 2020 compared to the previous year, with renewables (green) showing the only positive change. Source: IEA Global Energy Review

The chart below shows how a pandemic recovery, in which restrictions are gradually loosened over the course of the year, is expected to push low-carbon electricity sources to 40% of power generation in 2020, extending the slight lead on coal achieved last year. This would be the highest level on record, albeit due in part to a 5% dip in total electricity demand.

Global generation % shares from coal (red line) and low-carbon sources (shaded area), including nuclear (yellow) and all renewables (different shades of green). Source: IEA Global Energy Review

New projects coming online this year are expected to increase wind and solar’s share of global electricity generation up to 9%, twice as high as levels seen just five years ago.

The IEA estimates total renewable energy use, including for heat and transport, will rise by about 1% in 2020, and there will still be an increase even if economic recovery is slow. 

However, despite being more resilient than other industries, the renewable sector has still faced challenges. The end of 2020 marks an important deadline for new wind projects in the US and China to receive tax credits and subsidies, but progress on these projects is now highly uncertain.

In a recent blog post, IEA analyst Heymi Bahar writes that what was meant to be “an outstanding year for renewables” has been hindered by supply chain and labour disruptions linked to the pandemic.

Wind turbine manufacture has been hit particularly hard due to a very global supply chain compared with solar panels, which are largely manufactured in China.

Methods and discrepancies

When Carbon Brief attempted to calculate a figure for total CO2 emissions decline this year due to coronavirus, it reached a slightly more modest figure of  5.5%, compared to the IEA’s 8%.

This analysis was based on five key datasets that cover roughly three-quarters of the world’s annual CO2 emissions, with the expectation that the elements not covered would have added to the final total.

The IEA has access to a much larger array of detailed information, and its analysis was based on data available up until mid-April including country submissions to the IEA, other statistical releases from national administrations and estimates by the agency itself when official data was missing.

Published on Carbon Brief, 30 April 2020, under a CC license. Unadapted material may be reproduced in full for non-commercial use, credited ‘Carbon Brief’ with a link to the article.