Kehinde Wiley’s “St. Andrew” (oil and enamel on canvas in an antiquated frame with gilded ornament) of 2006.
A young man in contemporary street-wear straddles the cross on which he will die. The unusual cross is associated with St. Andrew, a disciple of Christ who was executed for refusing to renounce his faith.
Kehinde Wiley, “St. Andrew” (2006, oil and enamel on canvas in antiquated frame with gilded ornaments; detail)
Kehinde Wiley poses his contemporary St. Andrew against rich brocade that comes to life as it winds over the figure.
Kehinde Wiley, “St. Andrew” (2006, oil and enamel on canvas in antiquated frame with gilded ornaments)
The subject is painted in a powerful and dramatic Baroque style in strong contrast to the flat background.
Born in Los Angeles in 1977, Kehinde Wiley now lives and works in New York. He earned his BFA from the San Francisco Art Institute in 1999 and his MFA from Yale in 2001. He holds an honorary doctorate from the Rhode Island School of Design.
Represented by New York gallerist Sean Kelly, Wiley
“has firmly situated himself within art history’s portrait painting tradition.
“As a contemporary descendent of a long line of portraitists, including Reynolds, Gainsborough, Titian, Ingres, among others,
“Wiley engages the signs and visual rhetoric of the heroic, majestic, and the sublime in his representation of urban, black and brown men found throughout the world.”
The amount of CO2 being released by human activity each day fell by as much as 17% during the height of the coronavirus crisis in early April, a new study shows.
This means daily emissions temporarily fell to levels last seen in 2006, the study says. In the first four months of the year, it estimates that global emissions from burning fossil fuels and cement production were cut by 1,048m tonnes of CO2 (MtCO2), or 8.6%, compared with 2019 levels.
The research projects a decline of up to 2,729MtCO2 (7.5%) in 2020 as a whole, depending on how the crisis plays out. It is the first to have been through the peer-review process and is broadly in line with an early estimate for China published by Carbon Brief in February, as well as separate global estimates published last month by Carbon Brief and the International Energy Agency.
Today’s study also marks the first-ever attempt to quantify CO2 emissions on a daily basis, for the world and for 69 individual countries, in close to real time. Until now, annual CO2 emissions data has typically been published months or even years later.
A publicly available daily estimate of global or national CO2 emissions would be “incredibly useful, particularly for motivating policy action and pressure”, another researcher tells Carbon Brief.
Coronavirus crisis
The ongoing coronavirus crisis has claimed the lives of hundreds of thousands of people around the world and seen the introduction of severe restrictions on movement in many countries.
These lockdowns have included “stay at home” orders, border closures and other measures that have had direct effects on the use of energy and, consequently, on the release of CO2 emissions.
As the crisis has unfolded, so too have attempts to quantify its impact on CO2 emissions. These efforts have been challenging, however, because real-time CO2 emissions data does not exist.
The annual emissions inventories that countries submit to the UN take years to compile – and even these are estimates rather than direct measurements.
Greenhouse gas emissions are estimated using a variety of methods, often based on “activity data”. This might be the number of miles being driven, the amount of electricity generated or even – in the case of nitrous oxide, which is used as a propellant – via cream consumption.
Today’s study, published in Nature Climate Change, combines activity data for six sectors with a “confinement index” of lockdown measures in each country or region over time.
This allows for an estimate of changes in daily global CO2 emissions in January-April 2020, relative to the 100MtCO2 released on an average day in 2019.
During peak confinement in individual countries, daily CO2 emissions fell by 26% on average, the paper says. However, the size of this effect is reduced at a global level, because not all countries were under the most severe type of lockdown at the same time.
At the peak of the crisis in early April, regions responsible for 89% of daily CO2 emissions were under some form of lockdown, the paper says. Daily global CO2 emissions fell to 83MtCO2 (-17%, with a range of -11 to -25%) on 7 April, equivalent to levels last seen in 2006.
In a press release, lead author Prof Corinne Le Quéré, professor of climate change science at the University of East Anglia’s Tyndall Centre (who will be a panelist at Carbon Brief’s webinar on 21 May), says:
“Population confinement has led to drastic changes in energy use and CO2 emissions. These extreme decreases are likely to be temporary, however, as they do not reflect structural changes in the economic, transport, or energy systems.”
Daily data
In order to estimate daily global CO2 emissions, the researchers use a novel approach that combines sectoral activity data with a country-by-country confinement index.
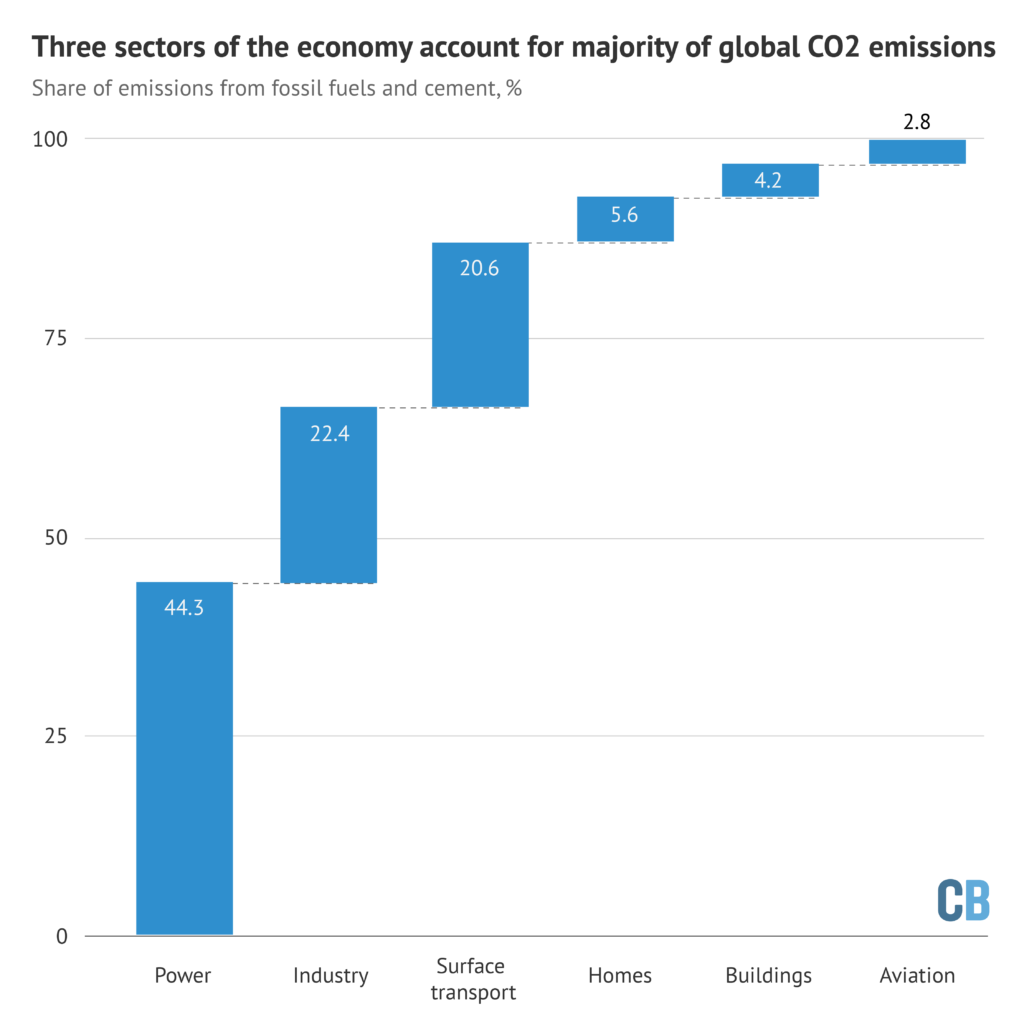
The paper looks at six sectors, shown in the chart below according to their share of global CO2 emissions from fossil fuels and cement. These are electricity and heat (44%); industry (22%); surface transport (20%); homes (6%); public buildings and commerce (4%); and aviation (3%).
Share of global CO2 emissions from fossil fuels and cement due to each of six sectors of the economy. Source: Le Queré et al. (2020). Chart by Carbon Brief.
Notably, this split highlights the limited potential for individual actions to radically reduce global emissions, in contrast to the societal choices that govern CO2 from electricity and industry.
The split in global CO2 emissions, shown above, is then broken down further for each of 69 countries, 50 US states and 30 Chinese provinces, which account for 97% of the global total. This gives industrial CO2 emissions in Italy, for example, on an average day in 2019.
The paper then uses 669 datasets, covering each of these sectors over time, and classified according to the level of confinement in place at each point. For example, this might be daily reports on mobility, traffic and congestion to measure “activity” for surface transport.
This daily data is then adjusted to remove effects unrelated to coronavirus, such as the mild northern hemisphere winter or the day of the week.
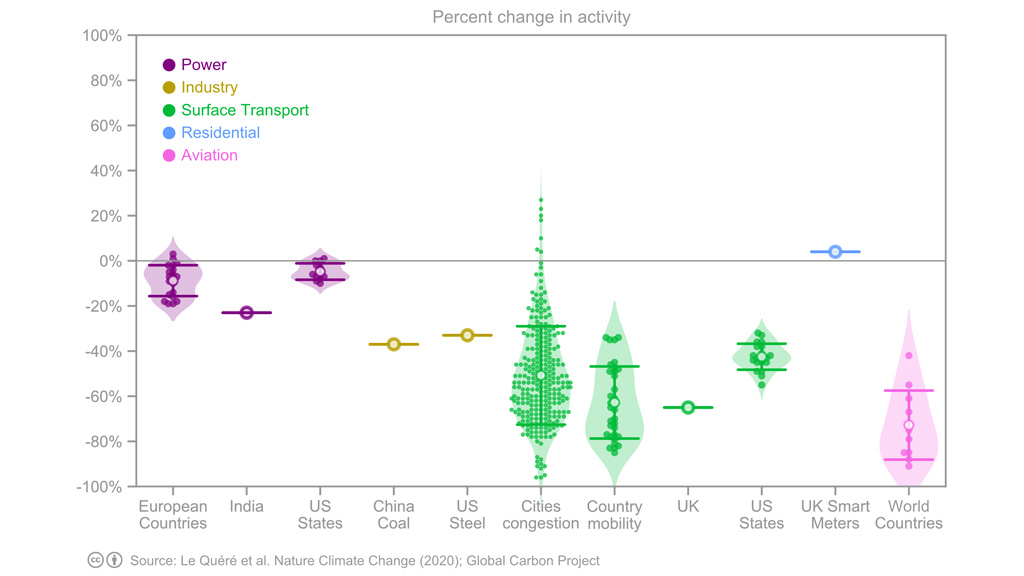
Under the highest level of confinement, surface transport “activity” fell by 50% on average, the paper finds. This is shown in green in the chart, below, where each dot represents a single data point, open circles show the average and the horizontal lines show the variability between datasets. The chart also shows changes in activity for electricity, industry, homes and aviation.
Change in sectoral “activity” under the highest level of coronavirus confinement, percent, relative to an average day in 2019. Each dot represents a single datapoint and open circles show the average. Reading from left to right, the chart shows activity changes in the power sector (purple), industry (yellow), surface transport (green), homes (blue) and aviation (pink). Source: Le Queré et al. (2020).
For electricity, the paper looks at total daily demand in Europe, the US and India, finding an average 15% reduction in demand under strict lockdown. In industry, the paper looks at daily coal use in China reported by Carbon Brief and weekly reports on steel production in the US.
For homes, the paper draws on figures from UK smart meters. And for aviation – the most strongly affected sector – it uses data on domestic and international departures around the world.
As the chart above shows, the analysis relies on relatively sparse information for industry, whereas activity levels in transport draw on a wider range of datasets.
Emissions estimates
The team then uses the average change in activity, for each sector and level of confinement, to build up an estimate of daily CO2 emissions around the world.
For example, on days when Turkey is under the strictest lockdown, the analysis assumes that its power-sector CO2 emissions would fall by 15% compared with the average in 2019 – and those from surface transport by 50%.
When Turkey shifts from “confinement index three”, the strictest controls, down to level two, its power-sector emissions would be 5% below usual levels and transport 40% lower. For each confinement level, the same percentage reductions are assumed to apply to all countries.
This approach means that the team only needed to know when each country, state or province changed its coronavirus lockdown from one “confinement level” to another, as well as the daily average level of CO2 emissions from each sector in 2019.
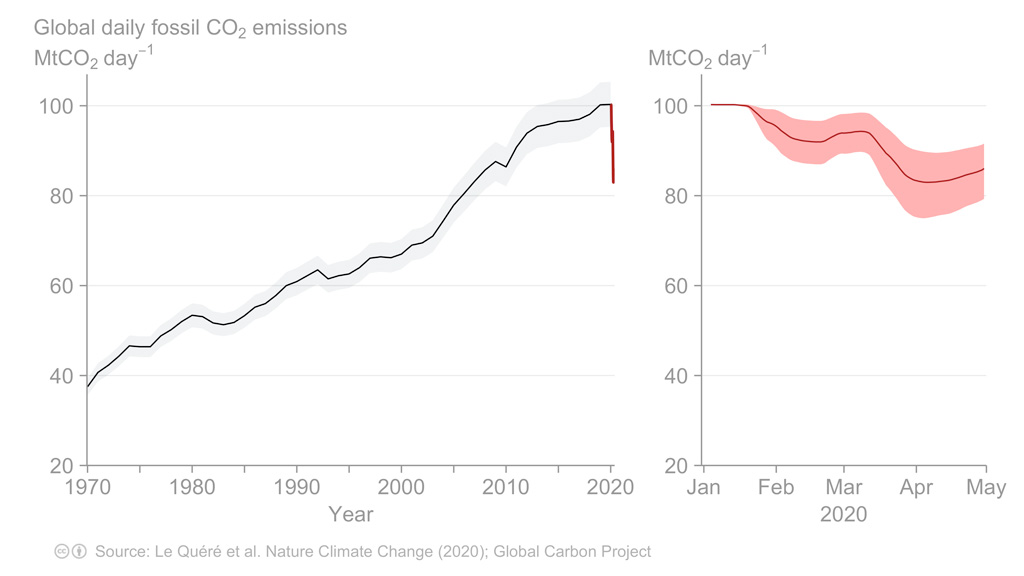
Putting all of these countries and lockdown levels together, the paper finds that the cut in daily global CO2 emissions peaked at -17% on 7 April, shown in the figure, below. Across the first four months of 2020, emissions fell by 1,048MtCO2 (8.6%), compared with 2019 levels.
Estimated daily global CO2 emissions from fossil fuels and cement, million tonnes (MtCO2 per day). The left panel shows emissions from 1970-2020 and the right panel shows the first four months of 2020. Source: Le Queré et al. (2020).
Within this global total, the largest impacts were in China, where emissions fell by an estimated 242MtCO2 in the first four months of the year, followed by the US (-207MtCO2), Europe (-123MtCO2) and India (-98MtCO2).
Dr Glen Peters, research director at Norwegian climate institute Cicero and one of the study authors, tells Carbon Brief that while the approach was designed around the current crisis, the team has gathered the “raw material” to make daily CO2 estimates on an ongoing basis. He says:
“We have discussed more ‘real-time’ estimates for sometime and there are many advantages. We are illustrating one advantage with our paper to see the consequences of particular policy interventions in near real time.”
But Peters notes that some of the daily data they used – the urban congestion index series from satnav maker TomTom, for example – is only being made publicly available during the current crisis and might be made private again in the future. He also asks whether daily data is truly needed, or whether weekly or even monthly estimates might be sufficient for scientists and policymakers.
“I think daily CO2 estimates would be incredibly useful, particularly for motivating policy action and pressure…Climate change already has the classic long-termism problem, but this is exacerbated by the fact that we get a figure on CO2 emissions published once a year, as a marker of how each country is doing.”
If daily CO2 estimates were publicly available for all countries, it would become possible to actively track progress, she says, adding: “You can have a counter on the news, or an app or dashboard on your phone – just like we do with other metrics like stock markets.”
Alternative analyses
Today’s research is not the first to analyse the CO2 impacts of the coronavirus crisis, although it is the first to have completed its passage through peer review.
Another paper, which is currently in review, also attempts to estimate daily global CO2 emissions in close to real time. This work finds the coronavirus crisis cut global emissions by -542MtCO2 below 2019 levels in the first quarter of 2020, similar to the -530MtCO2 figure from today’s paper.
In mid-February, Carbon Brief published an analysis showing that emissions in China were temporarily cut by 200MtCO2 (25%) over a four-week period, during the height of the restrictions. The new study finds that the cut in Chinese emissions peaked at 24%.
Today’s research also includes estimates of the emissions impact in 2020 as a whole, based on three scenarios for the length of lockdowns around the world. These entail CO2 emissions falling by between -4% and -8%, depending on how the crisis plays out. This range is consistent with estimates published in April byCarbon Brief (-6%) and the International Energy Agency (-8%).
Published under a CC license. You are welcome to reproduce unadapted material in full for non-commercial use, credited ‘Carbon Brief’ with a link to the article.
Clear water in Venice. Blue skies over Beijing. Air monitors in the city of Houston recording less ozone than normal. Clearer and crisper Austin skyline. The cleanest air ever recorded in Los Angeles.
“I think contemporary art changes how you look at the world. And that’s huge for everybody who comes into the situation.”
“Art as responsibility, art as a civic engagement, art has to be a force in society, art has to be courageous, unafraid, ecological, ecological. That was Joseph Beuys talking to my art teacher.”
“As a museum, you have a civic responsibility, you have a role in society, you have to be courageous, you have to open up your doors to allow for dialogue.”
“after 10 years of working for and with [MoMA PS1 board chair; president emerita & trustee, MoMA] Agnes Gund, I follow one very important principle in decision-making: ‘It’s not about you, it’s about the difference you can make.
The Museum of Contemporary Art (MOCA), established in 1979, is the only artist-founded museum in Los Angeles. As of late 2018 its endowment amounted to more than $134 million.
Klaus Biesenbach is MOCA’s sixth director, beginning work with the museum on 23 October 2018. He “’loves fundraising’” and sees his role at MOCA “as strictly administrative, focused on fundraising and growing the museum’s attendance, programming, endowment and board.”
Larry Bell, “Bill and Coo at MOCA’s nest” (site-specific installation, laminated glass, 2019), in the collection of the Museum of Contemporary Art, Los Angeles. Accession number: 2019-19. Purchase with funds provided by Carol and David Appel.
Larry Bell, “Bill and Coo at MOCA’s Nest” (site specific installation, laminated glass, two parts, 2019), in the collection of the Museum of Contemporary Art, Los Angeles. Accession number: 2019-19. Purchase with funds provided by Carol and David Appel. Installation view, MOCA Grand Avenue. Image courtesy of The Museum of Contemporary Art. Photo by Zak Kelley.
Prior to moving to Los Angeles to take up the directorship of MOCA, Klaus Biesenbach lived for 23 years in Manhattan. In 1995 he moved to New York from Berlin where, in 1991, as an intern for the East German government, he established Berlin’s Kunst-Werke Institute for Contemporary Art in a vacant former margarine factory.
Biesenbach worked initially with what was then called the P.S.1 Contemporary Art Center in New York. The P.S. 1 Contemporary Art Center was established in 1971 by Alanna Heiss as the Institute for Art and Urban Resources Inc., an organization devoted to organizing exhibitions in underutilized and abandoned spaces across New YorkCity.
The P.S.1 Contemporary Art Center became an affiliate of TheMuseum of Modern Art in 2000.
Biesenbach joined MoMA in 2004 with a concurrent role at MoMA PS1. He became director of MoMA PS1 in 2010, serving also as chief curator-at-large at MoMA.
Just weeks into his job at MOCA, Mr. Biesenbach described his view of the mission of museums: “’to be a resident among residents,’” “meant not only to display art but to support artists and greater civic life.”
“’“As
a museum, you have a civic responsibility, you have a role in
society, you have to be courageous, you have to open up your doors to
allow for dialogue.’”
“’After 10 years of working for and with [MoMA PS1 board chair] Agnes Gund, I follow one very important principle in decision-making: ‘It’s not about you, it’s about the difference you can make.’”’”
He
continues, a primary goal is now “’alignment. To develop a vision
for the museum and then align the board and the staff and all the
other constituencies. And vision doesn’t necessarily mean huge
buildings or blockbusters. It could also be a much more modest
vision: simply functioning.
“’I think contemporary art changes how you look at the world. And that’s huge for everybody who comes into the situation.’”
Growing up near Cologne, Germany, Mr. Biesenbach’s love for art began when he was in primary school. Joseph Beuys spoke through his art teacher, who had studied with him.
“Art
as responsibility, art as a civic engagement, art has to be a force
in society, art has to be courageous, unafraid, ecological,
ecological. That was Joseph Beuys talking to my art teacher. We were
like 8 or 9 years old!”
Full circle to today’s Los Angeles, and to today’s Houston, Beijing, Venice, and so many other cities.
Clear
water in Venice. Blue skies over Beijing. Air monitors in the city of
Houston recording less ozone than normal. Clearer and crisper Austin
skyline. The cleanest air ever recorded, in March 2020, in Los
Angeles.
Home not only to MOCA but also to The Broad (across the street from MOCA and founded by philanthropists Eli and Edythe Broad; Eli Broad was founding chairman of MOCA in 1979), the Hammer Museum (affiliated with UCLA), and the Los Angeles County Museum of Art amongst others, Los Angeles has seen a lifting of its “notorious L.A. Smog” due “to the fact that most Angelenos are driving less.”
“The
notorious L.A. smog starts as a cloud of traffic emissions that’s
spewed into the air during the morning rush hour. This layer of air
pollution is then held in place by a combination of the Southland’s
topography and its prevailing weather patterns, and baked for hours
in SoCal’s warm ultraviolet rays, an effect that air-quality
experts liken to a pot of soup heating on a stove.
“There’s no question that the drastic improvement in air quality—a combined measure of the particle pollution, carbon monoxide, sulfur dioxide, nitrogen dioxide, and ozone we breathe into our lungs—is due to the fact that most Angelenos are driving less and staying inside more.”
Better quality of air is observed also in Houston, home to numerous excellent museums including the Museum of Fine Arts, Houston (MFAH).
“The
primary reason, experts say, is fewer vehicles on the road, which
means fewer emissions from the petroleum-based fuels on which so much
of the Texas economy relies.” …
“In
Houston, where the huge volumes of commuters and sprawl of industrial
facilities often result in a lingering smog, emissions of nitrogen
oxides, which combine with other pollutants in the atmosphere to form
ozone, are already down 15 percent this month compared to last year.”
“The reduction in pollutants such as nitrogen dioxide and microscopic particulate matter, not to mention the carbon dioxide that is warming the planet, offers a temporary window on what the world might look like as governments worldwide move to cut greenhouse gas emissions to net-zero by mid-century.”
“A question we should be asking is, how do we maintain the better air quality without the economic consequences of shutter in place orders?’” Michael Webber, energy resources professor at theUniversity of Texas, Austin.
The economic consequences of “shutter in place orders” are dire.
In response to the outbreak of the coronavirus, MOCA, for instance, has laid off all 97 part-time employees. Almost all 69 full-time employees are taking a full or partial furlough or a significant salary reduction.
In correspondence with Deborah Vankin of the Los Angeles Times, Mr. Biesenbach writes, “the coronavirus crisis is changing lives in unprecedented ways and that he couldn’t say ‘how long this slow-burning catastrophe will grow and when it will end.”
“’Given
these uncertainties, we are taking significant measures to make sure
MOCA’s unique legacy and collection, built through the creative hard
work and contributions of so many will continue to be preserved and
accessible for generations to come.”
More
vulnerable than some other Los Angeles museums, MOCA does not enjoy
the financial privilege of a wealthy benefactor behind it, as does
the Broad (Eli Broad). Nor is the museum partially funded by a
university, as is the Hammer Museum. Nor is it so directly connected
to a government entity as is the Los Angeles County Museum of Art.
“’MOCA,’” rather, Biesenbach observes, “’is supported independently, mostly by individuals, and we have to navigate this crisis in our own way.’”
So
how might we maintain the better air quality without the economic
consequences of shutter in place orders?
A hint at forward direction might come from Cody A. Hill, Vice President, Energy Storage at LS Power.”
LS Power is “a development, investment, and operating company focused on power generation, electric transmission and energy infrastructure. We partner with communities across North America to create lower-cost, cleaner energy solutions.”
Mr. Hill has an MS in Electrical and ComputerEngineering from the University of Texas at Austin and is now based in the San Francisco Bay Area.
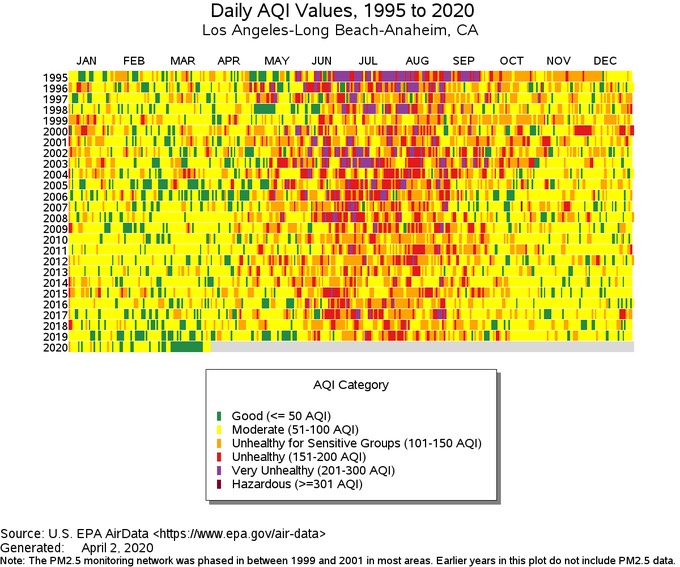
Sharing an “astounding chart from the EPA,” Mr. Hill (Twitter: @cody_a_hill) notes, in a tweet of 2 April 2020, that “Los Angeles had the cleanest air ever recorded there in March 2020.”
EPA, generated 2 April 2020, shared by Cody A. Hill, @cody_a_hill, via Twitter, 2 April 2020
Cody Hill continues in the same tweet, “This is mostly from reduced driving with the same vehicle fleet. It could be the new normal and ~13 million people living there would be healthier if we electrify transportation.”
· renewable energy sources are set to account for nearly 21 percent of the electricity the United States uses for the first time this year, up from about 18 percent last year and 10 percent in 2010
· renewable energy provides 18% of total U.S. power generation, up from 10% in 2010
· corporate PPA’s for renewal energy accelerated from 0.1 GW in 2010 to33.6 GW by year-end 2019, with a record breaking 13.6 GW in 2019 alone.
· the carbon intensity of the power sector continues to decline. From 2010 to 2019, power sector emissions fell nearly 25%
· total U.S. greenhouse gas (GHG) emissions have fallen 4.1% over thepast decade, and now sit at roughly 12% below 2005 levels
Art, philanthropy, energy. The relationships between them have history. As the way we generate energy evolves, the relationships between art, philanthropy, and energy will, in all likelihood, evolve as well.
Yves Tanguy (French, 1900-1955), “What” (oil on canvas, 1940), in the collection of the Museum of Fine Arts, Houston. The Joseph and Sylvia Slifka Collection. Object Number: 2004.146
“Houston,” observed Gary Tinterow, Director of the Museum of Fine Arts, Houston, in 2019, “is a cultural capital largely thanks to the discovery of oil.” (Houston Chronicle)
Yet, the energy economy is shifting in Texas. Renewable energy constitutes an ever increasing percentage of energy produced and used in Texas.
Texas, a competitive rather than regulated energy market, is first in the United States in wind power capacity and near to having the second-most capacity for solar PV after California.
Solar energy has a significant (“marvelous”) cost advantage over gas-fired power plants: the marginal cost of solar is zero. Texas is on course to build a quarter of the record new industrial-scale solar capacity being installed across the United States in 2020.
As the energy economy evolves, how will the philanthropy that supports so many museums and cultural institutions evolve?
Let’s begin our quest for understanding by taking a look at relationships between art, philanthropy, and energy. We’ll start by looking to Texas.
The U.S. state of Texas consumes the most electricity in the United States. Demand for energy in Texas has grown over five percent over the past five years even as it has declined nationwide (EIA as reported in the FT).
Adding
solar power through the incentives of a competitive electricity
market, Texas is near to having the second-most capacity for solar PV
after California. Texas, further, now ranks first in the United
States in wind power capacity.
Texas is home to the Museum of Fine Arts, Houston (MFAH). The MFAH is one of the largest museums in the United States. As of late 2011 it had the third-largest museum endowment.
The permanent collection of the MFAH consists of nearly 70,000 works from throughout the world, from antiquity to the present day (MFAH) .
Gary Tinterow, Director of the MFAH, grew up in Houston. He worked at New York’s Metropolitan Museum of Art for 28 years, serving from 2008 until his departure for Houston as chairman of the department of 19th-century, modern and contemporary art. Mr. Tinterow’s appointment as Director of the MFAH was finalized by the museum’s board of trustees in late November 2011. He started his new position in early 2012.
Richard D. Kinder, co-founder (February 1997) and now Executive Chairman of Kinder Morgan, Inc., one of North America’s largest energy infrastructure companies, serves as Life Trustee of the museum and Chairman of the Board of Trustees. Mr. Kinder served as chairman of the museum’s search committee that identified Mr. Tinterow as a candidate for the directorship of the museum.
The business of Kinder Morgan is involved primarily with oil, gas, and petroleum products. Kinder Morgan “owns an interest in or operates 83,000 miles of pipelines and 147 terminals. The company’s pipelines transport primarily natural gas, refined petroleum products, CO2 and crude oil and its terminals store, transfer and handle such products as gasoline, ethanol, coal, petroleum coke and steel.” (Kinder Morgan)
Mr. Kinder commended Mr. Tinterow: “Gary’s passion for the job and his encyclopedic knowledge were what convinced us. He has so many good ideas, and there is so much potential to make this one of the outstanding museums of the world.” (NYTimes)
For his part, Mr. Tinterow explained, “As sorry as I will be to leave the Met after 28 years, I think I’ve landed the best job in the world. It’s a matchless combination: a committed board, a passionate audience, a fine collection and an institution with the third-largest endowment in the country.” (NYTimes)
Mr.
Tinterow observed that the endowment of the Museum of Fine Arts,
Houston stood at $1 billion in December 2011 after the J. Paul Getty
Trust in Los Angeles, which oversees the J. Paul Getty Museum
(endowment: $4.8 billion) and the Metropolitan Museum of Art, New
York (endowment: $2.6 billion).
Asked in June 2019 after the relationship of the museum to energy companies and oil, Mr. Tinterow replied that he has “enormous respect for the energy industry.”
“Houston,” he continued, “is a cultural capital largely thanks to the discovery of oil.” (Houston Chronicle)
The Nancy and Rich Kinder Building, dedicated to art after 1900 from the MFAH collections, is scheduled to open in November 2020. Consisting of two floors and more than 100,000 square feet of exhibition space,the building will increase overall MFAH exhibition space by nearly 75%. (MFAH)
While the MFAH has benefited, and continues to benefit, from the business of oil, the mix of Texas energy is changing.
First in the United States in wind power capacity and near to having the second-most capacity for solar PV after California, Texas will build a quarter of the record new industrial-scale solar capacity being installed across the US in 2020 (EIA, FT).
The cost of solar has plummeted, with the average industrial-scale PV project just $0.80 per installed watt last year compared to $3.53/Win 2010, according to the “2020 Sustainable Energy in America Factbook”, produced for the Business Council for Sustainable Energy by BloombergNEF, that looks at the U.S. energy transition over the decade 2010 – 2020.
Solar has a significant cost advantage over gas-fired power plants. The marginal cost of solar is zero. “The key thing is they have a magnificent cost advantage over gas-fired power plants,” observes Edward Hirs, energy fellow at the University of Houston. “The marginal cost of solar is zero.” (FT)
Investors in renewable energy, with time horizons of more than a decade, moreover, like the stable returns of projects backed by long-term contracts. (FT)
Corporations are taking advantage of falling costs to sign long-term solar power purchase agreements. Of the record 13,600MW of clean energy deals that companies completed in the US in 2019, 5,500MW of deals were generated in Texas. The majority of the deals closed were based on solar energy according to the “2020 Sustainable Energy in America Factbook”.
Google, for instance, is committing to buy power from Texas solar plants.
Neha
Palmer, Google’s director of operations and head of energy
strategy, observes that “[Texas]
is a large, deregulated market. Users of electricity have a choice in
who they buy electricity from and the type of energy that they buy. I
think that’s been another driver of the large uptake of renewables
in the state.”
The solar energy travels from the Permian Basin in west Texas, where much of the investment in solar energy is taking place, to cities such as Dallas and Houston aided by special transmission lines. The state of Texas authorized the lines 15 years ago. Designed to handle wind power, they are now enabling the flow of solar also.
Largely disconnected from the interstate transmission networks to the east and west of Texas, the grid is exempted from federal oversight. It is operated by the non-profit body Ercot (Electric Reliability Council of Texas.
“The Ercot power market is designed to be the ultimate competitive market,” Mr Archer says. Chris Archer, head of Americas at Macquarie’s Green Investment Group, a solar and wind developer with projects in Texas.
“Generators are only paid for the energy that they sell, not for having capacity at the ready. Wholesale prices that average about $40 per megawatt-hour are allowed to climb as high as $9,000 per MWh when demand surges on the hottest afternoons, a potential windfall for generators. Solar farms’ output crests when the sun is highest, enabling them to participate in these sales.” (FT)
As renewables grow as a percentage of the energy mix in Texas, and elsewhere, we will follow the evolution of the relationship between art, philanthropy, and energy.
As the markets for works of art, collections care, and engineered resilience in the built environment (private collections, museums – public and private, galleries, fairs, corporate and university collections, etc.) converge, renewable energy will be a factor.
“Underlying property increases in value by virtue of the fact that positive externalities associated with the performance of the resilience investments represents a superior outcome to the status quo – even when netted out by any costs.” (Keenan et.al.)
Companies have signed long-term contracts to purchase solar and wind energy in 28 markets.
Cost declines and efficiency improvements are making renewables cost-competitive with wholesale power prices of more traditional sources of electricity.
While larger corporations are entering into corporate power purchase agreements (PPA),
smaller companies are increasingly pooling electricity demand together to access economies of scale achieved through solar and wind projects.
This is called “aggregation.”
“Aggregation” might be a workable model for entities in the art market concerned about the long-term resilience of structures and care and value of works and collections.
Sarah Zhang of The Atlantic spoke with Princeton University and UCLA economist Leah Boustan about Houston and Hurricane Harvey. They discussed to what extent the natural disaster that befell Houston might serve as an impetus for residents of Houston to migrate, to move elsewhere.
Dr. Boustan and her colleagues Matthew Kahn, Paul Rhode, and Maria Lucia Yanguas have tracked the effect of natural disasters on economic activity in US counties. Their study has included an examination of migration after 5,000 natural disasters in the United States between 1920 and 2010.
The following excerpts follow Ms. Zhang’s transcription of Dr. Boustan’s discussion.
Risk & infrastructure
Boustan: We do find a migration response to an event like that. But for a very severe disaster—and Harvey looks like it’s going to be in that category—the response is twice as large.
Part of that has to do with people learning about the risk factors. Maybe they didn’t know the area they’re living in is so susceptible to storms.
Part of it is watching whether the existing infrastructure really works. There’s discussions now about Houston not really having enough of a drainage system. People might have known, yes, there are tropical storms, but they may not have understood the tropical storm is going to be such a devastating effect.
FEMA & centralized disaster response
Boustan: FEMA started in the early ’70s, and it gets its own independent status as an agency in ’78. We looked at before and after the ’70s, there was a hypothesis, well—and I’ve heard a lot of this post-Harvey—that when you have centralized disaster response, there’s not really an incentive to move out.
Moral hazard
Zhang: This is the idea of “moral hazard”: When you’re protected from the consequences of your actions, you take more risks.
Boustan: Right, like there’s going to be big government payout, and that encourages people to stay put in places that are risky. You know you’ll get your FEMA payout. We actually didn’t have any difference of course in the migration response before and after FEMA.
Centralized government response & disasters are getting worse
Boustan: But of course, this is really just a before and after, and there’s a lot things about the ’40s, ’50s, and ’60s, that could be different about the ’80s, ’90s, and 2000s. In particular, you can really see the number of disasters and severity of disasters increasing. There are two things going on that could be kind of confounding. On one hand, there’s government response. On the other hand, disaster activity is getting worse. We can’t really separate those two things, but it looks like because disasters are getting worse, there’s just as much of a migration response more recently than there was in the ’30s, ’40s, and ’50s.
The Houston metropolitan area has grown by about 400 people a day, building about 40,000 housing units a year. This has made Houston the nation’s largest new-housing market, with seven percent of the nation’s residential construction. Regulation has been light, the civic model tied to growth. Building everywhere and fast, the city has kept housing prices low.
“You have a country that’s divided between high cost places like Bay Area and New York and higher unemployment areas like Detroit, and places like Houston pick up the slack,” observed Issi Romem, chief economist at BuildZoom, a startup that helps people find contractors, both residential and commercial.
The New York Times reported on September 12 that people in Houston are “betting that nothing can stop Houston’s continued growth”.
“Redfin, a national real estate brokerage firm, said its agents had 45 home buyers lined up to purchase homes here when the storm hit. Only eight buyers backed out because of the storm, and tour requests immediately rebounded a week later.
“‘I was shocked,” said Glenn Kelman, the company’s chief executive, who lives in Seattle.
“For now, buyers and sellers are trying to figure out how prices have changed after the flood. The Powells’ potential buyer and many others are looking for a deal on a damaged home.
“At the same time, many economists are forecasting that the price of undamaged homes will rise as demand outstrips supply. Early estimates suggest that tens of thousands of homes were damaged, and developers are worried about labor shortages as repairs get priority over new construction.”
Then, on September 13, Inman reported that Houston homes sales have declined 24% year-over-year in August.
“Home sales were humming throughout the first three weeks of August, but the moment Harvey struck the region, everything came to a screeching halt,” said HAR (Houston Association of Realtors) chair Cindy Hamann.
“HAR’s latest monthly report shows that all segments of the Houston housing market felt the strain.
“August sales of property types across the board totaled 7,077, a 24 percent decline compared to the same month last year, while total dollar volume dropped 22 percent to $2.0 billion. After 10 consecutive months of gains, single-family home sales took a 25 percent year-over-year hit.”
In August, Business Insider gave some thought to the Houston housing market and vulnerabilities. Houston is a city with 800 miles of creeks and bayous that can easily overflow during a storm surge. It has seen 38,000 acres of wetlands disappear in the last two decades due to a construction boom in greater Houston. The city is flat and drainage systems are outdated. Developers, further, have often not followed the federal wetlands mandate. And building regulations have not accounted for historic flooding levels.
Having passed through Hurricane Harvey with an emergency team onsite 24/7 to monitor and manage everything throughout the duration of the storm, the Museum of Fine Arts, Houston has shared information about its protocol for storm protection.
This information could prove helpful and encouraging to other arts institutions. A lesson to be learned: best to have an emergency plan and protocols in place ahead of possible natural disasters … and practice.
Here are some elements of the MFAH emergency protocol:
a hurricane-preparedness team
storm-planning measures to secure the buildings
sandbags (the MFAH has thousands of sandbags, each filled with sand the museum stores and re-cycles)
emergency water pumps (sump pumps)
floodgates to be activated as needed (the MFAH floodgates are house-made and 24-inches high)
preparation of a disaster-recovery website
a 24/7 emergency team to be stationed on site to monitor everything through the duration of the storm
the MFAH crew includes more than 30 people, each with a list of emergency contacts, including first and second responders, printed on a slip of waterproof Tyvek in their pockets. the team splits 18-hour shifts.
engineers
art handlers
IT
security guards
the chief technology officer (Shemon Bar-Tal)
the chief of building operations (Mike Pierce)
the chief operating officer (Willard Holmes)
relocation of works | works of art that are in potentially vulnerable locations to be moved as needed
a sense of humor, perspective, and humility
“Mother Nature and water are strange. You say, ‘I’m OK, I’ve got a floodgate, I’m good,’ and then she comes around the back door!” (Willard Holmes, COO)
“I think we’re really good on the broad strokes, but you can never just assume that the next storm is going to be like the one that just passed. If the last four days have taught us anything, it’s that it’s not over until it’s over.” (Willard Holmes, COO)
The permanent collection of the MFAH includes 65,000 paintings, sculptures and other objects at the main campus and at Bayou Bend and Rienzi, two historical estates along Buffalo Bayou, the city’s central waterway.
Paint the Revolution includes works by Frida Kahlo, Diego Rivera, Antonio Ruiz, Alfredo Ramos Martínez, María Izquierdo, José Clemente Orozco, Tina Modotti, Adolfo Best Maugard, and Saturnino Herrán.
Ronald D. Spencer, Chairman of the Art Law Practice at the New York law firm of Carter Ledyard & Milburn LLP, addresses the issue of the valuation of loss or damage to art for an insurance claim. He specifically addresses the use of, and questions the appropriateness of the use of, “blockage” and “blockage discounts” as applicable standards for interpreting the loss valuation provisions of an insurance contract.
The insurance coverage amount is the maximum amount the policy will pay. This amount provides the basis for calculation of insurance premiums. Most insurance claims do not involve claims for the full coverage amount.
The methodology used by the insurer to value a damage claim is a relevant variable for the insured. Most art insurance policies are vague, however, on the valuation method, “providing, simply, that in the event of disagreement on the value of the loss, the insured and insurer will each retain their own appraisers, and if the appraisers do not agree on the value of the loss, the dispute is to be submitted to an umpire or arbitrator, whose decision will be final.”
New York’s Bruce Silverstein Gallerysuffered loss on October 29, 2012 caused by flooding during Hurricane Sandy. The gallery had an “All Risks Fine Art Dealers Floater” insurance policy with a “Basis of Valuation” provision stipulating that “consigned property shall be valued at the Agreed Net Consigned Value Plus 10%.” The concept of “blockage” was applied by the umpire representing the gallery’s insurance company. This was the first time the concept of “blockage” for art sales, which first arose in 1972 in the context of art valuations for estate tax purposes, was applied to an art valuation for purposes of calculating a loss for an insurance claim.
When valuing the loss of many artworks, the concept of “blockage” values works as they could be sold on one particular date, the date of the disaster (or death, in the framework of estate sales) on which the loss takes place. Blockage discounts the present value of the works of art based on future streams of income from sales over the period of time it would require to sell the art.
The application of blockage is considered to be consistent with USPAP Standard 6 which provides that when a large mass of property is to be valued as of a specific date, the appraiser is required to take into account that the value of the whole may be different from that of the individual parts.
Mr. Spencer observes that “by choosing to apply a blockage discount to an insurance loss valuation, an umpire, in effect, is deciding that the insurance loss should be determined by the price a bulk buyer of the art at the date of loss would be willing to pay.”
He observes, further, that “the art owner should understand that the result of a blockage discount for the owners’ insurance claim is that the more art the owner has lost, the less the insurer will pay per item—the larger the volume of art lost, the greater the blockage discount for each piece.”
Develop a straightforward emergency plan. This advice for artists and collectors is suggested by Anne Rappa, Senior Vice President, Fine Art Insurance, with Huntington T. Block, the oldest and largest managing general underwriter of Fine Art Insurance in the United States.
Such plans are created based on very simple pieces of information. Such information includes contact information for conservators and art storage facilities and assessments of needed physical protections. Gather the information together and write it down.
Isaac Kaplan of Artsy writes:
“Anne Rappa, senior vice president with fine arts insurer Huntington T. Block, urged anxious artists and collectors to look to museums for guidance, namely by developing a straightforward plan—such as compiling conservator or art storage facility contact information and assessing what physical protections are needed for the work. And, she stressed, be sure to write everything down.
“’When you use the words ‘disaster mitigation’ or ‘disaster planning,’ it sounds complicated,’ Rappa said. “But those plans are created based on very simple pieces of information that are culled together and put in one place. It’s the advanced thought that is so important.”
“One simple tip, she said, for artists and art owners facing water damage: Buy some blotting paper.”