Kehinde Wiley’s “St. Andrew” (oil and enamel on canvas in an antiquated frame with gilded ornament) of 2006.
A young man in contemporary street-wear straddles the cross on which he will die. The unusual cross is associated with St. Andrew, a disciple of Christ who was executed for refusing to renounce his faith.
Kehinde Wiley, “St. Andrew” (2006, oil and enamel on canvas in antiquated frame with gilded ornaments; detail)
Kehinde Wiley poses his contemporary St. Andrew against rich brocade that comes to life as it winds over the figure.
Kehinde Wiley, “St. Andrew” (2006, oil and enamel on canvas in antiquated frame with gilded ornaments)
The subject is painted in a powerful and dramatic Baroque style in strong contrast to the flat background.
Born in Los Angeles in 1977, Kehinde Wiley now lives and works in New York. He earned his BFA from the San Francisco Art Institute in 1999 and his MFA from Yale in 2001. He holds an honorary doctorate from the Rhode Island School of Design.
Represented by New York gallerist Sean Kelly, Wiley
“has firmly situated himself within art history’s portrait painting tradition.
“As a contemporary descendent of a long line of portraitists, including Reynolds, Gainsborough, Titian, Ingres, among others,
“Wiley engages the signs and visual rhetoric of the heroic, majestic, and the sublime in his representation of urban, black and brown men found throughout the world.”
The amount of CO2 being released by human activity each day fell by as much as 17% during the height of the coronavirus crisis in early April, a new study shows.
This means daily emissions temporarily fell to levels last seen in 2006, the study says. In the first four months of the year, it estimates that global emissions from burning fossil fuels and cement production were cut by 1,048m tonnes of CO2 (MtCO2), or 8.6%, compared with 2019 levels.
The research projects a decline of up to 2,729MtCO2 (7.5%) in 2020 as a whole, depending on how the crisis plays out. It is the first to have been through the peer-review process and is broadly in line with an early estimate for China published by Carbon Brief in February, as well as separate global estimates published last month by Carbon Brief and the International Energy Agency.
Today’s study also marks the first-ever attempt to quantify CO2 emissions on a daily basis, for the world and for 69 individual countries, in close to real time. Until now, annual CO2 emissions data has typically been published months or even years later.
A publicly available daily estimate of global or national CO2 emissions would be “incredibly useful, particularly for motivating policy action and pressure”, another researcher tells Carbon Brief.
Coronavirus crisis
The ongoing coronavirus crisis has claimed the lives of hundreds of thousands of people around the world and seen the introduction of severe restrictions on movement in many countries.
These lockdowns have included “stay at home” orders, border closures and other measures that have had direct effects on the use of energy and, consequently, on the release of CO2 emissions.
As the crisis has unfolded, so too have attempts to quantify its impact on CO2 emissions. These efforts have been challenging, however, because real-time CO2 emissions data does not exist.
The annual emissions inventories that countries submit to the UN take years to compile – and even these are estimates rather than direct measurements.
Greenhouse gas emissions are estimated using a variety of methods, often based on “activity data”. This might be the number of miles being driven, the amount of electricity generated or even – in the case of nitrous oxide, which is used as a propellant – via cream consumption.
Today’s study, published in Nature Climate Change, combines activity data for six sectors with a “confinement index” of lockdown measures in each country or region over time.
This allows for an estimate of changes in daily global CO2 emissions in January-April 2020, relative to the 100MtCO2 released on an average day in 2019.
During peak confinement in individual countries, daily CO2 emissions fell by 26% on average, the paper says. However, the size of this effect is reduced at a global level, because not all countries were under the most severe type of lockdown at the same time.
At the peak of the crisis in early April, regions responsible for 89% of daily CO2 emissions were under some form of lockdown, the paper says. Daily global CO2 emissions fell to 83MtCO2 (-17%, with a range of -11 to -25%) on 7 April, equivalent to levels last seen in 2006.
In a press release, lead author Prof Corinne Le Quéré, professor of climate change science at the University of East Anglia’s Tyndall Centre (who will be a panelist at Carbon Brief’s webinar on 21 May), says:
“Population confinement has led to drastic changes in energy use and CO2 emissions. These extreme decreases are likely to be temporary, however, as they do not reflect structural changes in the economic, transport, or energy systems.”
Daily data
In order to estimate daily global CO2 emissions, the researchers use a novel approach that combines sectoral activity data with a country-by-country confinement index.
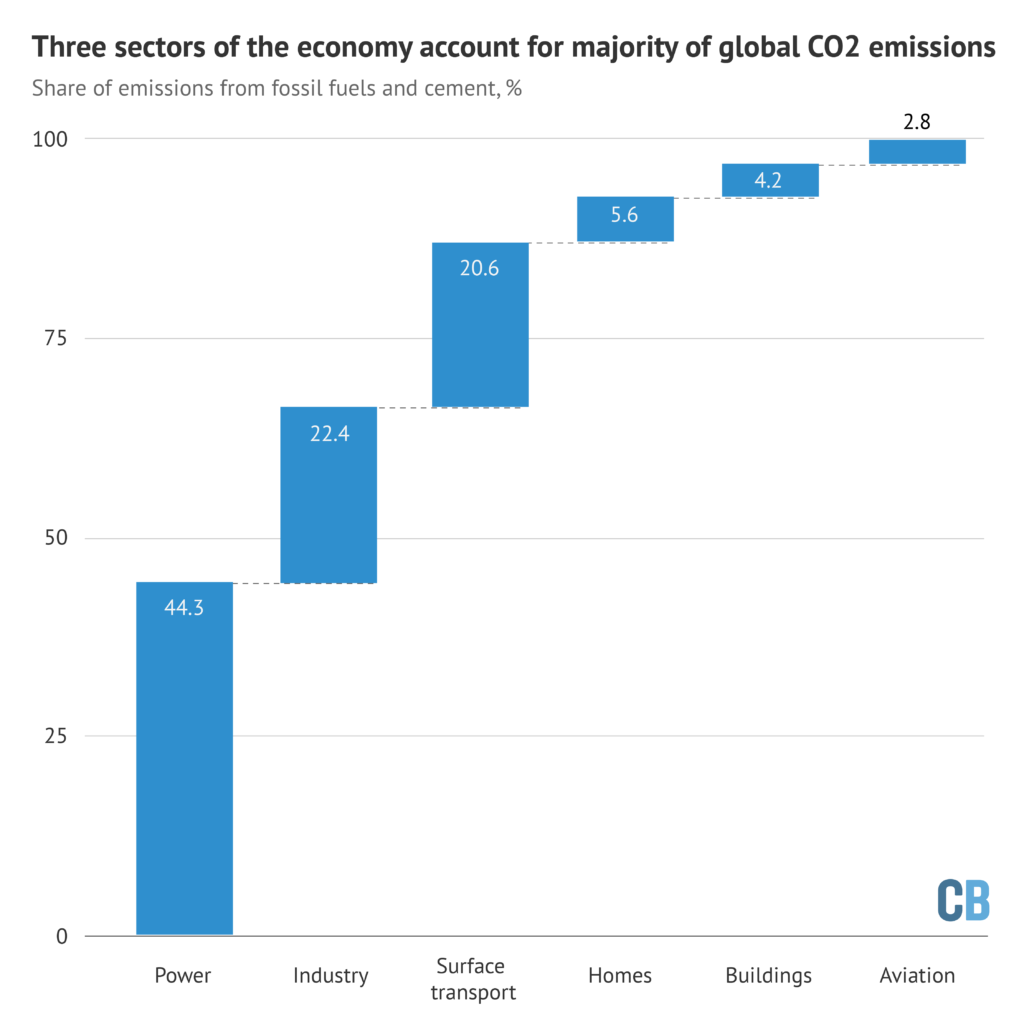
The paper looks at six sectors, shown in the chart below according to their share of global CO2 emissions from fossil fuels and cement. These are electricity and heat (44%); industry (22%); surface transport (20%); homes (6%); public buildings and commerce (4%); and aviation (3%).
Share of global CO2 emissions from fossil fuels and cement due to each of six sectors of the economy. Source: Le Queré et al. (2020). Chart by Carbon Brief.
Notably, this split highlights the limited potential for individual actions to radically reduce global emissions, in contrast to the societal choices that govern CO2 from electricity and industry.
The split in global CO2 emissions, shown above, is then broken down further for each of 69 countries, 50 US states and 30 Chinese provinces, which account for 97% of the global total. This gives industrial CO2 emissions in Italy, for example, on an average day in 2019.
The paper then uses 669 datasets, covering each of these sectors over time, and classified according to the level of confinement in place at each point. For example, this might be daily reports on mobility, traffic and congestion to measure “activity” for surface transport.
This daily data is then adjusted to remove effects unrelated to coronavirus, such as the mild northern hemisphere winter or the day of the week.
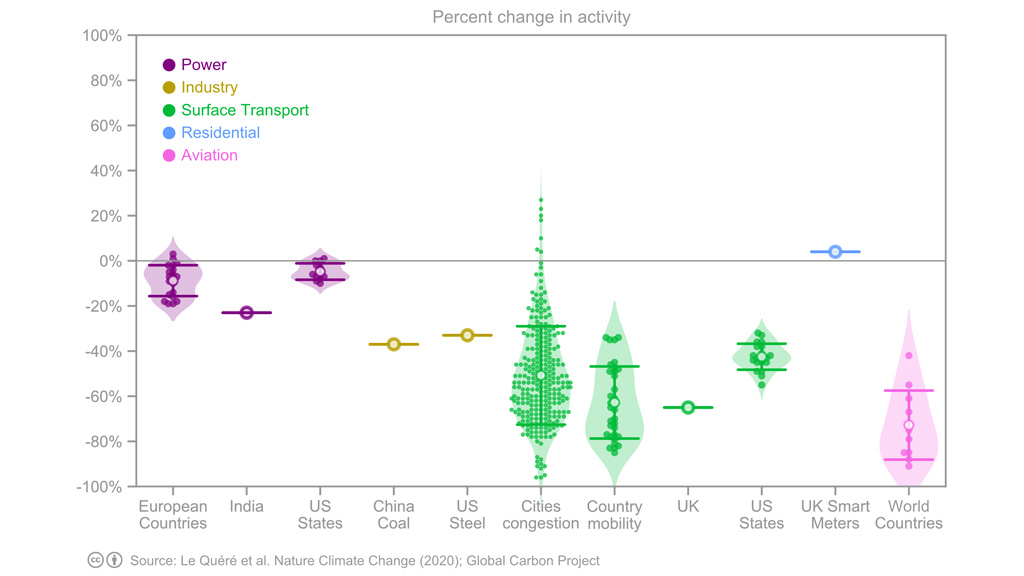
Under the highest level of confinement, surface transport “activity” fell by 50% on average, the paper finds. This is shown in green in the chart, below, where each dot represents a single data point, open circles show the average and the horizontal lines show the variability between datasets. The chart also shows changes in activity for electricity, industry, homes and aviation.
Change in sectoral “activity” under the highest level of coronavirus confinement, percent, relative to an average day in 2019. Each dot represents a single datapoint and open circles show the average. Reading from left to right, the chart shows activity changes in the power sector (purple), industry (yellow), surface transport (green), homes (blue) and aviation (pink). Source: Le Queré et al. (2020).
For electricity, the paper looks at total daily demand in Europe, the US and India, finding an average 15% reduction in demand under strict lockdown. In industry, the paper looks at daily coal use in China reported by Carbon Brief and weekly reports on steel production in the US.
For homes, the paper draws on figures from UK smart meters. And for aviation – the most strongly affected sector – it uses data on domestic and international departures around the world.
As the chart above shows, the analysis relies on relatively sparse information for industry, whereas activity levels in transport draw on a wider range of datasets.
Emissions estimates
The team then uses the average change in activity, for each sector and level of confinement, to build up an estimate of daily CO2 emissions around the world.
For example, on days when Turkey is under the strictest lockdown, the analysis assumes that its power-sector CO2 emissions would fall by 15% compared with the average in 2019 – and those from surface transport by 50%.
When Turkey shifts from “confinement index three”, the strictest controls, down to level two, its power-sector emissions would be 5% below usual levels and transport 40% lower. For each confinement level, the same percentage reductions are assumed to apply to all countries.
This approach means that the team only needed to know when each country, state or province changed its coronavirus lockdown from one “confinement level” to another, as well as the daily average level of CO2 emissions from each sector in 2019.
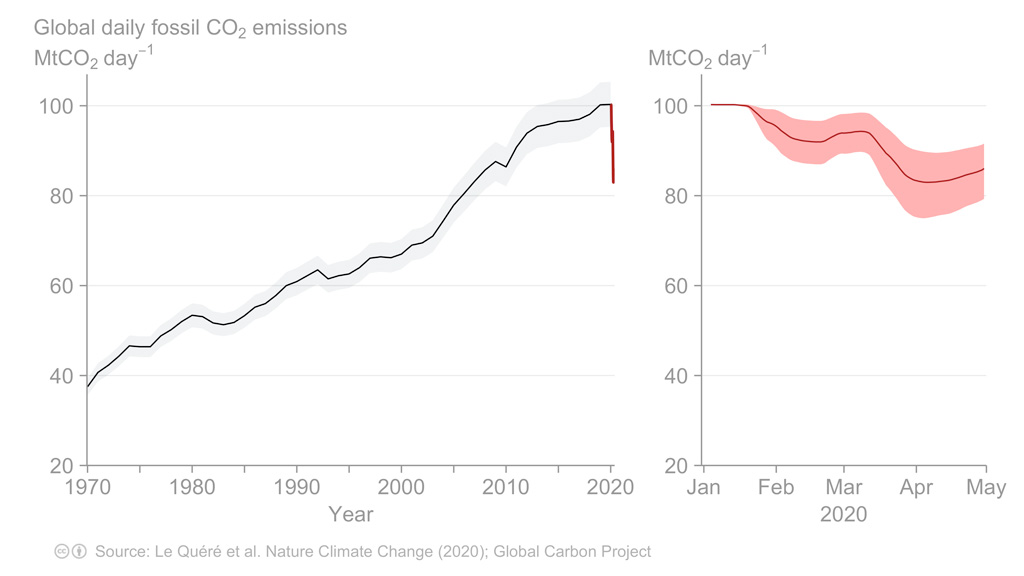
Putting all of these countries and lockdown levels together, the paper finds that the cut in daily global CO2 emissions peaked at -17% on 7 April, shown in the figure, below. Across the first four months of 2020, emissions fell by 1,048MtCO2 (8.6%), compared with 2019 levels.
Estimated daily global CO2 emissions from fossil fuels and cement, million tonnes (MtCO2 per day). The left panel shows emissions from 1970-2020 and the right panel shows the first four months of 2020. Source: Le Queré et al. (2020).
Within this global total, the largest impacts were in China, where emissions fell by an estimated 242MtCO2 in the first four months of the year, followed by the US (-207MtCO2), Europe (-123MtCO2) and India (-98MtCO2).
Dr Glen Peters, research director at Norwegian climate institute Cicero and one of the study authors, tells Carbon Brief that while the approach was designed around the current crisis, the team has gathered the “raw material” to make daily CO2 estimates on an ongoing basis. He says:
“We have discussed more ‘real-time’ estimates for sometime and there are many advantages. We are illustrating one advantage with our paper to see the consequences of particular policy interventions in near real time.”
But Peters notes that some of the daily data they used – the urban congestion index series from satnav maker TomTom, for example – is only being made publicly available during the current crisis and might be made private again in the future. He also asks whether daily data is truly needed, or whether weekly or even monthly estimates might be sufficient for scientists and policymakers.
“I think daily CO2 estimates would be incredibly useful, particularly for motivating policy action and pressure…Climate change already has the classic long-termism problem, but this is exacerbated by the fact that we get a figure on CO2 emissions published once a year, as a marker of how each country is doing.”
If daily CO2 estimates were publicly available for all countries, it would become possible to actively track progress, she says, adding: “You can have a counter on the news, or an app or dashboard on your phone – just like we do with other metrics like stock markets.”
Alternative analyses
Today’s research is not the first to analyse the CO2 impacts of the coronavirus crisis, although it is the first to have completed its passage through peer review.
Another paper, which is currently in review, also attempts to estimate daily global CO2 emissions in close to real time. This work finds the coronavirus crisis cut global emissions by -542MtCO2 below 2019 levels in the first quarter of 2020, similar to the -530MtCO2 figure from today’s paper.
In mid-February, Carbon Brief published an analysis showing that emissions in China were temporarily cut by 200MtCO2 (25%) over a four-week period, during the height of the restrictions. The new study finds that the cut in Chinese emissions peaked at 24%.
Today’s research also includes estimates of the emissions impact in 2020 as a whole, based on three scenarios for the length of lockdowns around the world. These entail CO2 emissions falling by between -4% and -8%, depending on how the crisis plays out. This range is consistent with estimates published in April byCarbon Brief (-6%) and the International Energy Agency (-8%).
Published under a CC license. You are welcome to reproduce unadapted material in full for non-commercial use, credited ‘Carbon Brief’ with a link to the article.
Clear water in Venice. Blue skies over Beijing. Air monitors in the city of Houston recording less ozone than normal. Clearer and crisper Austin skyline. The cleanest air ever recorded in Los Angeles.
“I think contemporary art changes how you look at the world. And that’s huge for everybody who comes into the situation.”
“Art as responsibility, art as a civic engagement, art has to be a force in society, art has to be courageous, unafraid, ecological, ecological. That was Joseph Beuys talking to my art teacher.”
“As a museum, you have a civic responsibility, you have a role in society, you have to be courageous, you have to open up your doors to allow for dialogue.”
“after 10 years of working for and with [MoMA PS1 board chair; president emerita & trustee, MoMA] Agnes Gund, I follow one very important principle in decision-making: ‘It’s not about you, it’s about the difference you can make.
The Museum of Contemporary Art (MOCA), established in 1979, is the only artist-founded museum in Los Angeles. As of late 2018 its endowment amounted to more than $134 million.
Klaus Biesenbach is MOCA’s sixth director, beginning work with the museum on 23 October 2018. He “’loves fundraising’” and sees his role at MOCA “as strictly administrative, focused on fundraising and growing the museum’s attendance, programming, endowment and board.”
Larry Bell, “Bill and Coo at MOCA’s nest” (site-specific installation, laminated glass, 2019), in the collection of the Museum of Contemporary Art, Los Angeles. Accession number: 2019-19. Purchase with funds provided by Carol and David Appel.
Larry Bell, “Bill and Coo at MOCA’s Nest” (site specific installation, laminated glass, two parts, 2019), in the collection of the Museum of Contemporary Art, Los Angeles. Accession number: 2019-19. Purchase with funds provided by Carol and David Appel. Installation view, MOCA Grand Avenue. Image courtesy of The Museum of Contemporary Art. Photo by Zak Kelley.
Prior to moving to Los Angeles to take up the directorship of MOCA, Klaus Biesenbach lived for 23 years in Manhattan. In 1995 he moved to New York from Berlin where, in 1991, as an intern for the East German government, he established Berlin’s Kunst-Werke Institute for Contemporary Art in a vacant former margarine factory.
Biesenbach worked initially with what was then called the P.S.1 Contemporary Art Center in New York. The P.S. 1 Contemporary Art Center was established in 1971 by Alanna Heiss as the Institute for Art and Urban Resources Inc., an organization devoted to organizing exhibitions in underutilized and abandoned spaces across New YorkCity.
The P.S.1 Contemporary Art Center became an affiliate of TheMuseum of Modern Art in 2000.
Biesenbach joined MoMA in 2004 with a concurrent role at MoMA PS1. He became director of MoMA PS1 in 2010, serving also as chief curator-at-large at MoMA.
Just weeks into his job at MOCA, Mr. Biesenbach described his view of the mission of museums: “’to be a resident among residents,’” “meant not only to display art but to support artists and greater civic life.”
“’“As
a museum, you have a civic responsibility, you have a role in
society, you have to be courageous, you have to open up your doors to
allow for dialogue.’”
“’After 10 years of working for and with [MoMA PS1 board chair] Agnes Gund, I follow one very important principle in decision-making: ‘It’s not about you, it’s about the difference you can make.’”’”
He
continues, a primary goal is now “’alignment. To develop a vision
for the museum and then align the board and the staff and all the
other constituencies. And vision doesn’t necessarily mean huge
buildings or blockbusters. It could also be a much more modest
vision: simply functioning.
“’I think contemporary art changes how you look at the world. And that’s huge for everybody who comes into the situation.’”
Growing up near Cologne, Germany, Mr. Biesenbach’s love for art began when he was in primary school. Joseph Beuys spoke through his art teacher, who had studied with him.
“Art
as responsibility, art as a civic engagement, art has to be a force
in society, art has to be courageous, unafraid, ecological,
ecological. That was Joseph Beuys talking to my art teacher. We were
like 8 or 9 years old!”
Full circle to today’s Los Angeles, and to today’s Houston, Beijing, Venice, and so many other cities.
Clear
water in Venice. Blue skies over Beijing. Air monitors in the city of
Houston recording less ozone than normal. Clearer and crisper Austin
skyline. The cleanest air ever recorded, in March 2020, in Los
Angeles.
Home not only to MOCA but also to The Broad (across the street from MOCA and founded by philanthropists Eli and Edythe Broad; Eli Broad was founding chairman of MOCA in 1979), the Hammer Museum (affiliated with UCLA), and the Los Angeles County Museum of Art amongst others, Los Angeles has seen a lifting of its “notorious L.A. Smog” due “to the fact that most Angelenos are driving less.”
“The
notorious L.A. smog starts as a cloud of traffic emissions that’s
spewed into the air during the morning rush hour. This layer of air
pollution is then held in place by a combination of the Southland’s
topography and its prevailing weather patterns, and baked for hours
in SoCal’s warm ultraviolet rays, an effect that air-quality
experts liken to a pot of soup heating on a stove.
“There’s no question that the drastic improvement in air quality—a combined measure of the particle pollution, carbon monoxide, sulfur dioxide, nitrogen dioxide, and ozone we breathe into our lungs—is due to the fact that most Angelenos are driving less and staying inside more.”
Better quality of air is observed also in Houston, home to numerous excellent museums including the Museum of Fine Arts, Houston (MFAH).
“The
primary reason, experts say, is fewer vehicles on the road, which
means fewer emissions from the petroleum-based fuels on which so much
of the Texas economy relies.” …
“In
Houston, where the huge volumes of commuters and sprawl of industrial
facilities often result in a lingering smog, emissions of nitrogen
oxides, which combine with other pollutants in the atmosphere to form
ozone, are already down 15 percent this month compared to last year.”
“The reduction in pollutants such as nitrogen dioxide and microscopic particulate matter, not to mention the carbon dioxide that is warming the planet, offers a temporary window on what the world might look like as governments worldwide move to cut greenhouse gas emissions to net-zero by mid-century.”
“A question we should be asking is, how do we maintain the better air quality without the economic consequences of shutter in place orders?’” Michael Webber, energy resources professor at theUniversity of Texas, Austin.
The economic consequences of “shutter in place orders” are dire.
In response to the outbreak of the coronavirus, MOCA, for instance, has laid off all 97 part-time employees. Almost all 69 full-time employees are taking a full or partial furlough or a significant salary reduction.
In correspondence with Deborah Vankin of the Los Angeles Times, Mr. Biesenbach writes, “the coronavirus crisis is changing lives in unprecedented ways and that he couldn’t say ‘how long this slow-burning catastrophe will grow and when it will end.”
“’Given
these uncertainties, we are taking significant measures to make sure
MOCA’s unique legacy and collection, built through the creative hard
work and contributions of so many will continue to be preserved and
accessible for generations to come.”
More
vulnerable than some other Los Angeles museums, MOCA does not enjoy
the financial privilege of a wealthy benefactor behind it, as does
the Broad (Eli Broad). Nor is the museum partially funded by a
university, as is the Hammer Museum. Nor is it so directly connected
to a government entity as is the Los Angeles County Museum of Art.
“’MOCA,’” rather, Biesenbach observes, “’is supported independently, mostly by individuals, and we have to navigate this crisis in our own way.’”
So
how might we maintain the better air quality without the economic
consequences of shutter in place orders?
A hint at forward direction might come from Cody A. Hill, Vice President, Energy Storage at LS Power.”
LS Power is “a development, investment, and operating company focused on power generation, electric transmission and energy infrastructure. We partner with communities across North America to create lower-cost, cleaner energy solutions.”
Mr. Hill has an MS in Electrical and ComputerEngineering from the University of Texas at Austin and is now based in the San Francisco Bay Area.
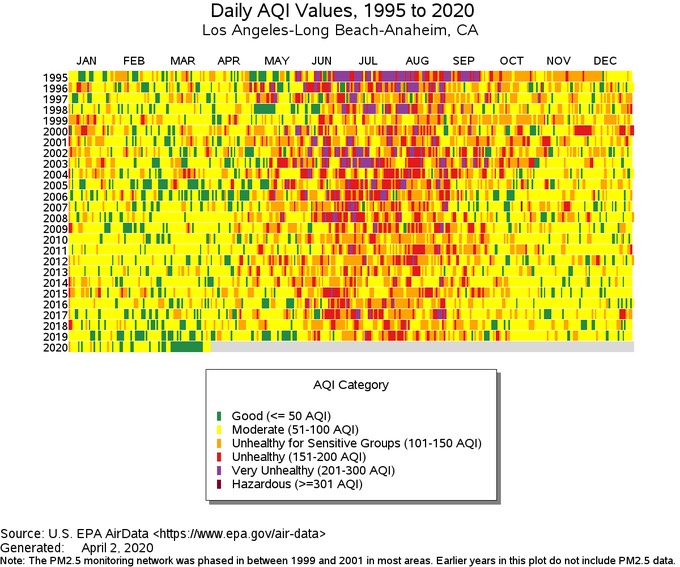
Sharing an “astounding chart from the EPA,” Mr. Hill (Twitter: @cody_a_hill) notes, in a tweet of 2 April 2020, that “Los Angeles had the cleanest air ever recorded there in March 2020.”
EPA, generated 2 April 2020, shared by Cody A. Hill, @cody_a_hill, via Twitter, 2 April 2020
Cody Hill continues in the same tweet, “This is mostly from reduced driving with the same vehicle fleet. It could be the new normal and ~13 million people living there would be healthier if we electrify transportation.”
California, in so many ways, could learn from the US Northeast.
To reduce CO2 and and greenhouse gas emissions from cars, a continuing and increasing issue in California and elsewhere, cities need data—ways to accurately measure emissions, pinpoint sources, and monitor change over time; cities need to know how much CO2 they are producing and reducing.
A tool called ACES (Anthropogenic Carbon Emissions System) was developed in response to the requirement for data by researchers at Boston University and Harvard. ACES offers finely-grained maps of CO2 emissions, with a resolution of 1km2, totaled hourly.
As we know, per our atmosphere – the air, its particular mix of gaseous elements, and its temperatures, together vital to life, inclusive of human, animal, and plant – CO2 and other greenhouse gases are an issue, in many ways.
California has “targets” to meet by the year 2020 for limiting the greenhouse gases associated with the driving that people do on a daily basis. The approach to greenhouse gases associated with the driving that people do on a daily basis has a heightened level of complexity in California. Driving a car, rather than availing oneself of public transportation such as a subway, metro, or bus, is a norm that people are highly unwilling and actually afraid to examine and rethink. The many localities within the state have made limited investment in public transportation in significant part because taking such modes of transportation is largely considered to be beneath the dignity – whether personal, social, or professional – of and compromising to anybody with a sense of self esteem.
While the “hope” has been that climate emissions might be curbed largely by promoting regional planning of denser development along transit lines ( S.B. 375, the Sustainable Communities and Climate Protection Act, a landmark 2008 deal, with the California legislature recognizing the critical role of integrated transportation, land use, and housing decisions to meet state climate goals), the California Air Resources Board 2018 Progress Report released in November documents that driving of cars has skyrocketed statewide during the years following the recession of 2008 – 2009 through 2016.
A “key finding of this report is that California is not on track to meet the greenhouse gas reductions expected under SB 375 for 2020, with emissions from statewide passenger vehicle travel per capita increasing and going in the wrong direction” (page 4) and “emissions from the transportation sector continuing to rise despite increases in fuel efficiency and decreases in the carbon content of fuel” (page 5).
Top air quality officials in California state they currently have no way to fully assess whether regions from San Diego to Sacramento are on track to meet 2020 targets for reigning in greenhouse gases associated with daily driving. While “greenhouse gas emissions considered under the SB 375 program reflect carbon-dioxide (CO2) emissions only from light-duty passenger vehicles” (page 21, footnote 22), the California Air Resources Board 2018 Progress Report states, “SB 375 passenger vehicle greenhouse gas emissions reductions cannot be directly measured because greenhouse gas emissions come from many sources” (page 21).
Air board officials said that while they tracked the key metric of vehicle miles traveled, or VMT, available statewide through fuel sales, that same information wasn’t available regionally. Without that, officials say there is no consistent way to extrapolate greenhouse gas emissions from driving for each region.
“There’s no unifying way to bring it all together and say ‘You’re at this particular performance metric,’” said Nicole Dolney, chief of the air board’s transportation planning branch. “Our hope was that we would have VMT data that we could rely on, but it wasn’t there.”
So what might California learn from ACES?
“For cities to cut down CO2, they need to know how much they are producing and reducing. Most cities get rough estimates with “carbon calculators” that account for the size and population of a city, electricity used, and an estimate of how many cars zip (or crawl) through the city streets.
“The calculation would be fine except for all those cars. Cars are the hardest part of the emissions equation to quantify. They are moving all the time at different speeds, and there are different cars on the road at different times of day.”
“There are other factors to consider. There’s the make of the car, of course: a Toyota Prius gives off less CO2 than a Chevy Silverado. There’s also the speed; most cars give off the least CO2 when cruising in a “sweet spot” between 40 and 60 miles per hour.”
(Conor Gately, co-developer of ACES; PhD, Geography and Environment, Boston University, 2016; lead author on a study examining cities, traffic, and CO2,published in the Proceedings of the National Academy of Sciences (PNAS) in April 2015.)
ACES (Anthropogenic Carbon Emissions System) has been developed by Lucy Hutyra of Boston University and Conor Gately, now a postdoctoral associate working jointly at Boston University and Harvard. A tool for measuring and mapping CO2 emissions, ACES offers finely-grained maps of CO2 emissions, with a resolution of 1km2, totaled hourly, is relevant and could be helpful to the cities and the state of California.
“Cities have the political will to change emissions, and they have policy levers to pull,” says Lucy Hutyra, a Boston University College of Arts & Sciences (CAS) associate professor of Earth and environment. And because cities are responsible for 70 percent of greenhouse-gas emissions, according to the United Nations, their actions matter. But to take effective action, cities need data—ways to accurately measure emissions, pinpoint sources, and monitor change over time. And so Hutyra and her colleague Conor Gately have developed a tool called ACES, for Anthropogenic Carbon Emissions System, that offers the finest-grained maps of CO2 emissions in the Northeastern US to date, with a resolution of 1km2, totaled hourly. The tool, funded by NASA’s Carbon Monitoring System and detailed in the October 12, 2017, issue of the Journal of Geophysical Research—Atmospheres, could provide valuable data to cities nationwide.
“‘The goal was to take the finest grained, most local data possible and build a ‘bottom-up’ inventory,” says Gately. The research team started by divvying up the sources of emissions on a giant whiteboard. “We did every sector of emissions of CO2,” he says. “Roads, residential buildings, commercial buildings, industrial facilities, power plants, airports, marine ports, shipping, and railway.” The group searched for data from 2011, scouring every source they could find: city and country records, household fuel estimates, EPA databases, hundreds of traffic sensors located around New England. All of these data, when combined with the amount of fossil fuels consumed in the region (gasoline, diesel, home heating oil, coal and natural gas for power generation), allowed the team to calculate CO2 emissions for all of the major sources. The team then calculated emissions for every hour of the year.
“Gately, working with a three-year, $1.5 million grant from the National Oceanic and Atmospheric Administration, is now expanding ACES to cover the entire continental United States and meeting with government, scientific, and policy stakeholders to help create a core set of methods and data products.”
DARTE might also be helpful. DARTE, the Database of Road Transportation Emissions (Conor Gately, Lucy Hutyra, Ian Sue Wing) is available for free download from the Harvard Dataverse
Funded by grants from the National Aeronautics and Space Administration (NASA), the National Science Foundation (NSF), and the Department of Energy (DOE), Gately has developed a more precise way to tally CO2 emissions from vehicles. He used 33 years of traffic data to build the Database of Road Transportation Emissions (DARTE), which displays CO2 data for the contiguous US on a finer scale than ever before—a one-kilometer grid. (He hopes to add Alaska and Hawaii later.) Available for free download, DARTE could change the way cities and states measure greenhouse gas emissions.
“The science is coming together to bring us very fine measurements in a way never possible before,” says Lucy Hutyra, an assistant professor of earth and environment and a coauthor on the PNAS study. Hutyra says that DARTE complements NASA’s Orbiting Carbon Observatory 2, which is collecting global data on atmospheric carbon dioxide. “We need good bottom-up data to match what we’re measuring looking down from space. That’s what we need to really advance greenhouse gas policies.”
As the markets for works of art, collections care, and engineered resilience in the built environment (private collections, museums – public and private, galleries, fairs, corporate and university collections, etc.) converge, renewable energy will be a factor.
“Underlying property increases in value by virtue of the fact that positive externalities associated with the performance of the resilience investments represents a superior outcome to the status quo – even when netted out by any costs.” (Keenan et.al.)
Companies have signed long-term contracts to purchase solar and wind energy in 28 markets.
Cost declines and efficiency improvements are making renewables cost-competitive with wholesale power prices of more traditional sources of electricity.
While larger corporations are entering into corporate power purchase agreements (PPA),
smaller companies are increasingly pooling electricity demand together to access economies of scale achieved through solar and wind projects.
This is called “aggregation.”
“Aggregation” might be a workable model for entities in the art market concerned about the long-term resilience of structures and care and value of works and collections.
Liu Wei regenerates various segments of Beijing’s high-rise buildings into digitalized geometric structures of bright hues of pinks, yellows, blues, and greens.
The image was rendered digitally on a computer and then painted onto a larger canvas.
While modern and “digital,” Liu Wei connects with, while seeking to re-explore, more traditional landscape painting. Note the moon and the pine tree, traditional motifs.
Liu Wei, born in Beijing in 1972, is one of China’s leading contemporary artists. He lives and works in Beijing and is represented by Lehmann Maupin.
Rather than “subversively reference politics,” he often looks for inspiration in found objects and architectural constructions, expressing his views of a changing material landscape.
Liu Wei’s work is included in numerous collections such as the Astrup Fearnley Museet, Oslo; the Leeum, Samsung Museum of Art, Seoul; M+ Sigg Collection, Hong Kong; the Rubell Family Collection, Miami; and White Rabbit Gallery, Sydney.
Kehinde Wiley’s “St. Andrew” (oil and enamel on canvas in an antiquated frame with gilded ornament) of 2006.
A young man in contemporary street-wear straddles the cross on which he will die. The unusual cross is associated with St. Andrew, a disciple of Christ who was executed for refusing to renounce his faith.
Kehinde Wiley poses his contemporary St. Andrew against rich brocade that comes to life as it winds over the figure.
The subject is painted in a powerful and dramatic Baroque style in strong contrast to the flat background.
Kehinde Wiley, born in Los Angeles in 1977, now lives and works in New York. He earned his BFA from the San Francisco Art Institute in 1999 and his MFA from Yale in 2001.
Represented by New York gallerist Sean Kelly, Wiley “has firmly situated himself within art history’s portrait painting tradition.
“As a contemporary descendent of a long line of portraitists, including Reynolds, Gainsborough, Titian, Ingres, among others,
“Wiley engages the signs and visual rhetoric of the heroic, majestic, and the sublime in his representation of urban, black and brown men found throughout the world.”
Kehinde Wiley’s “St. Andrew,” a museum purchase of 2014, is now in the collection of Norfolk, Virginia’s Chrysler Museum of Art.
Dan Colen’s “TBT” (chewing gum and gum wrappers on canvas, in artist’s frame, 2008) sold at the Phillips Auction New York Contemporary Art Day sale of 17 May 2013 for $305,000.
Born in Leonia, New Jersey in 1979 and a 2001 BFA graduate of the Rhode Island School of Design, Dan Colen has long questioned the “editorial decisions artists have to make when creating a scene from scratch on canvas.”
Stepping away from paint as a medium in 2006, Colen started using chewing gum. In 2008 he wrote, “When I first started, the canvases were very sparse … It slowly developed into a more elaborate and involved process. I started adding a lot more gum to each canvas; I would put pieces down, pick them up again, move ’em around, stretch them out, mush ’em together, and mix flavors to create new colors”.
Dan Colen creates his work in a variety of media – painting, sculpture, photography, performance, and installation – from a variety of materials including gum, dirt, grass, tar, feathers, and street trash from the street.
He examines cultural mythologies and archetypes, the boundaries between “high” and “low” art, and the artist’s measure of “control” over the behavior of a given material.
Dan Colen’s recent “Purgatory” (2017) is a work of strong imagination and probing. On view at New York’s Lévy Gorvy Gallery, that now collaborates with Gagosian and Massimo De Carlo to represent Mr. Colen, stylistically it is as if by another artist entirely. Oil on canvas in deep reds and black, the painting draws the viewer frighteningly in along a diagonal through a tunnel of dark clouds back towards a receding glow.
The Astrup Fearnley Museum of Modern Art is a privately owned contemporary art museum in Oslo, Norway. The museum was funded by two philanthropic organizations, the Thomas Fearnley Foundation and the Heddy and Nils Astrup Foundation, that merged in 1995 to form the Thomas Fearnley, Heddy and Nils Astrup Foundation.
Established and opened to the public in 1993, the museum moved into two new buildings in 2012.
The collecting focus of the museum is Norwegian and international contemporary art. Artists represented include Olafur Eliasson, Francis Bacon, Janine Antoni, Dan Colen, Cao Fei, Olav Christoper Jenssen, Elmgreen & Dragset, Jeff Koons, Fischli & Weiss, Sigmar Polke, Richard Prince, Charles Ray, Gerhard Richter, Torbjørn Rødland, Matthew Ronay, Cindy Sherman, and Christopher Wool.
Mark Bradford’s “Constitution IV” (mixed media on canvas, 2013) sold, from the collection of Fredric Brandt, plastic surgeon to the stars, for £3,778,500 at the Phillips London Contemporary Art Evening Sale of 14 October 2015. This sale set an auction record, since exceeded, for the artist.
Mark Bradford, born in Los Angeles, California in 1961, continues to live and work in Los Angeles. He has been exclusively represented by Hauser & Wirth since 2015.
Christopher Bedford, director of the Baltimore Museum of Art, considers Mark Bradford to be “the most important living abstract painter”.
The catalogue prepared by Phillips observes that “Mark Bradford’s vast tactile works characterized by their décollaged surfaces, evoke a sense of transience and instability. In compositions such as ‘Constitution IV’ however, these ideas transcend material objects and infiltrate less physical subjects consequently, indicating the fragility of seemingly solid notions.”
The essay continues, “Using printed text through his collage and décollage technique the canvas becomes a surface offering insights into further meanings and depths … Thus, the viewer is drawn into Bradford’s works in order to try and draw meaning from the myriad of letters flickering in and out of focus.”