
‘Construction fever’ responsible for one fifth of China’s CO2 emissions
***
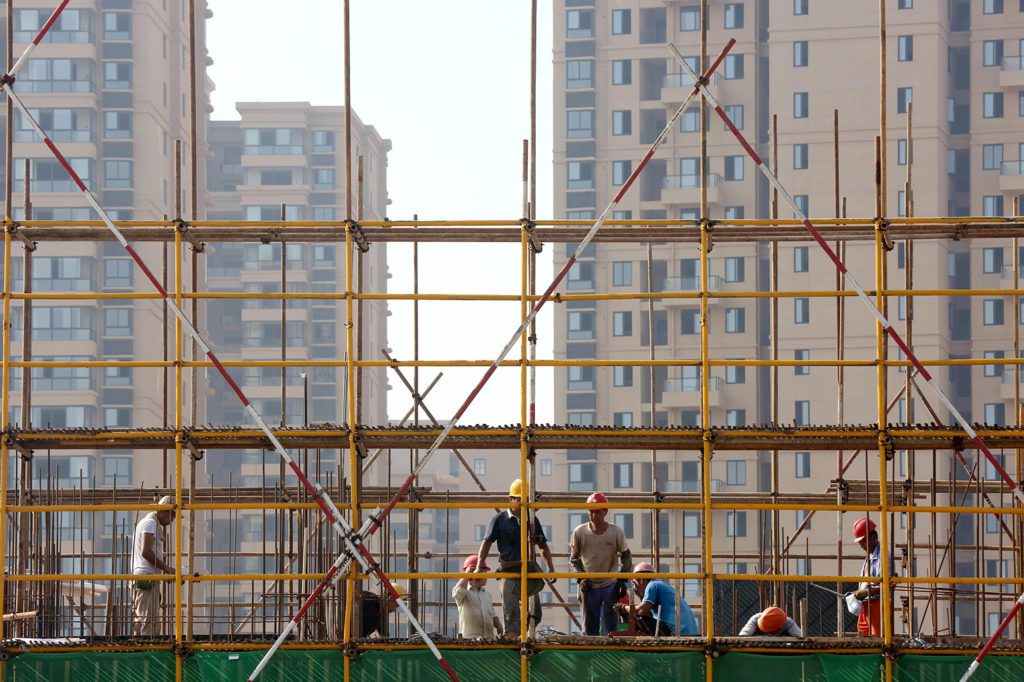
The construction and demolition of buildings in China was responsible for nearly a fifth of the nation’s annual CO2 emissions in 2015, according to a new study.
The world’s largest emitter has seen building rates soar as existing structures are torn down and replaced with skyscrapers to house the nation’s rapidly urbanising population.
All of this comes with a significant carbon footprint, both to produce the cement, steel and other materials required and from the emissions produced once the project is underway.
The researchers behind the new study, published in the Journal of Cleaner Production, say this has not received enough attention in China, despite being an “unignorable and critical” component of the nation’s emissions.
However, other academics Carbon Brief talked to said that while China’s construction “boom” is undoubtedly carbon-intensive, there are “issues” with the methods used in this analysis.
‘Construction fever’
A growing urban population and land scarcity have contributed to significant growth in construction – particularly of high-rise buildings – across China.
Since 2010, China has been responsible for around half of the world’s growth in construction, with many buildings only standing for around 30 years before being demolished.
Their construction, maintenance and demolition all come with a carbon cost. Previous studies have estimated that the energy consumption of China’s building sector has more than tripled since 2001.
Xinyi Shen from Greenpeace East Asia tells Carbon Brief that, given this, it is not surprising that China’s “construction fever” is a primary driver of its emissions.
However, in the new study, a team led by PhD candidate Weina Zhu of Tsinghua University, make the distinction between “operational” and “embodied” CO2 emissions, emphasizing the need to focus on the latter.
Embodied CO2 is defined in the paper as total emissions from “building materials manufacturing and transportation, building construction, maintenance and demolition”. Operational emissions are those arising from day-to-day energy use – for example, lighting, heating and cooling.
The authors say that operational carbon is generally assumed to be the primary contributor to the sector’s emissions, meaning strategies have focused on improving the energy efficiency of buildings.
However, they say that if China is to hit its climate target of peaking emissions in 2030, it will need to make embodied emissions a priority.
Time lapse showing the development that has taken place in Shanghai between 1984-2018. Source: Google Earth Engine
Bottom-up and top-down
The researchers looked at building activity throughout 2015, a year when Chinese economic stimulus – and the construction it helps drive – was reportedly at relatively low levels.
To estimate the embodied CO2 for construction that year – excluding civil engineering projects, such as bridges and roads – the researchers used two different approaches.
First, they used a process-based assessment. This was a “bottom-up” method that involved working out the total emissions of all the processes feeding into Chinese construction, from chemical reactions in cement factories to machinery used on building sites.
For the second assessment they used an input-output model. This was a “top-down” approach for which the team took national data and isolated the relevant components.
One of the paper’s co-authors, Dr Wei Feng, tells Carbon Brief this is “the first systematic analysis” of China’s embodied CO2 emissions using both of these methods.
Results based on the process approach showed that the embodied carbon in the Chinese building sector for that year was 1,422m tonnes of CO2 (MtCO2), while the input-output method settled on 1,600MtCO2.
Based on the upper estimate, they note this was approximately 18% of total Chinese emissions reported in 2015.
Residential buildings had around twice the emissions cost of non-residential buildings. The study notes how China’s housing has shifted from brick and wood to reinforced concrete and steel high-rise structures.
Crucially, the researchers say their estimate puts embodied CO2 roughly on a par with past estimates of operational CO2.
Dr Francesco Pomponi, an engineer at Edinburgh Napier University who was not involved in the study, tells Carbon Brief this seems more plausible than many other comparisons between operational and embodied CO2:
“Previous assessments we have had suggested 20% embodied, 80% operational or less than that, whereas this study is pointing towards a more realistic picture – about half and half.”
As a comparison, a report from last year by the World Green Building Council concluded 11% of annual global emissions were from carbon embodied in building construction processes. Nearly three times as much came from operational building emissions.
While around 10% of European states’ annual emissions can be traced to embodied building carbon, Pomponi says a value of roughly double this seems accurate for an economy such as China.
“I go every year so I see the difference year after year in how much built stock was added in 12 months,” he says.
‘Red flags’
However, Dr Jannik Giesekam, an industrial climate policy researcher at the University of Leeds who has worked extensively in this area but was not involved in the study, tells Carbon Brief he identified numerous “red flags” in the research.
While he thinks the researchers probably arrived at the right “ballpark figure”, he has “major” issues with the paper that he thinks compromise the results.
One of the key points he identified was that the paper overlooked a lot of pre-existing work on embodied carbon, including databases prepared by industry “in favour of a selective set of case studies”.
He also says the paper does not make a comparison with previous estimates for China or to previous systematic reviews prepared by the likes of the International Energy Agency (IEA).
While acknowledging some of these points as valid, Feng says they chose case studies that reflect current Chinese common practices and that they could not retrieve the relevant emissions data from the industry databases Giesekam suggests.
“Overall, it would be different and unrealistic to use international emission data and best practices to represent China’s emission in 2015,” he tells Carbon Brief.
For his part, Pomponi says that while Giesekam’s criticism is valid, he sees things “slightly differently”. He says: “I think it’s impossible that a study incorporates everything that’s out there.”
Giesekam also notes what he sees as some unusual choices in the way the researchers carried out the study, including a lack of detail in both their “bottom-up” and “top down” calculations – for example, giving all steel the same “carbon factor”.
Feng says that while they would “love this study to go deeper” and describes his team’s work in this area as on-going, he notes they used a “simple approach” that involved taking averages of steel and cement data:
“That is why we also employ a top-down method to cross-validate the bottom-up method calculation to make sure the total emission results match with each other.”
To this point, Pomponi tells Carbon Brief it is “inevitable to sacrifice depth for breadth in academic research” and says that, while there are certainly issues with the paper, he thinks it is valuable to see different methods being used to assess embodied carbon:
“It’s really good they used two [approaches] and compared them. They are extremely different methods so it’s good that they seem to point to the same number.”
Cutting embodied CO2
The researchers say that on a global scale, the relatively limited attention paid to embodied carbon is preventing an accurate assessment of the building sector’s environmental impacts.
Dr Danielle Densley Tingley, an architectural engineer at the University of Sheffield who was not involved in the work, says these emissions are generally not given sufficient attention by nations setting climate targets. She tells Carbon Brief this is partly due to the way they are reported:
“They’re often lumped into ‘industrial emissions’. This focuses on the production of the materials – where there are only small efficiencies left to gain – but doesn’t really look at how the materials are then used, what is driving their consumption etc.”
She says better design and a focus on “deep retrofits” instead of demolition would help cut embodied emissions in buildings. Pomponi agrees that design lies at the heart of this issue:
“At the moment we are inefficient in the sense that we put more material than is actually needed into buildings … Firms tend to go with ‘rules of thumb’ or things that worked in the past rather than starting from scratch.”
Measures have been proposed to cut these emissions in some countries. The World Green Building Council has set a target of 40% less embodied carbon in all new buildings, infrastructure and renovations by 2030.
The authors of the new study estimate that, despite a focus on operational carbon emissions in China, the annual potential for reductions in the building sector could actually be larger for embodied than operational CO2.
Greenpeace East Asia’s Shen says that after years of intensive construction the situation is shifting and, going forward, the Chinese authorities are going to have to be “extremely careful” about what they build:
“The country has entered into a new stage of development in that blindly putting up more infrastructure is not only environmentally unsustainable but also will not keep the same investment return the country yielded in the last decades.”
Zhu, W. et al. (2020) Analysis of the embodied carbon dioxide in the building sector: A case of China, Journal of Cleaner Production, doi.org/10.1016/j.jclepro.2020.122438
***
“‘Construction fever’ responsible for one fifth of China’s CO2 emissions“
Originally published under a CC license by Carbon Brief on 9 June 2020
Published under a CC license. You are welcome to reproduce unadapted material in full for non-commercial use, credited ‘Carbon Brief’ with a link to the article.