IEA: Coronavirus ‘accelerating closure’ of ageing fossil-fuelled power plants

IEA: Coronavirus ‘accelerating closure’ of ageing fossil-fuelled power plants

Josh Gabbatiss, Carbon Brief, 27 May 2020

***

This year will see the largest ever drop globally in both investment and consumer spending on energy as the coronavirus pandemic hits every major sector, according to the International Energy Agency (IEA).

The crisis is accelerating the shutdown of older fossil-fuelled power plants and refineries, with the agency saying it could provide an opportunity to push the global energy sector onto a “more resilient, secure and sustainable path”.

In the latest edition of the World Energy Investment report, which Carbon Brief has covered in previous years, the IEA has gone beyond its usual remit of reviewing annual trends. 

Its analysis looks ahead to the coming year and estimates the impact of this year’s economic turmoil on energy investment, which was expected to grow by around 2% prior to Covid-19. It is now expected to drop by 20%, or almost $400bn.

Meanwhile, as demand and prices collapse, consumer spending on oil is expected to drop by more than $1tn, prompting a “historic switch” as spending on electricity exceeds oil for the first time.

Here, Carbon Brief has picked out some key charts to illustrate the economic repercussions of the pandemic across the energy sector.

Energy investment will drop by a fifth

The “baseline expectation” for 2020 is a global recession resulting from widespread lockdowns, according to the IEA. Last month, the agency estimated this will also lead to CO2 emissions dropping by 8% this year in the largest decline ever recorded.

Based on the latest investment data and project information, announcements from companies and governments, interviews with industry figures and its own analysis, the IEA concludes such a recession will see energy investment drop by a fifth. This can be seen in the chart below.
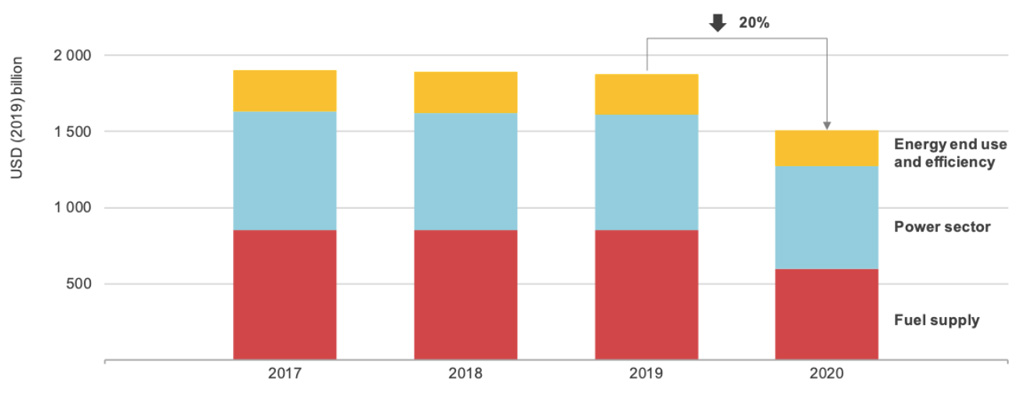
Energy investment is set to fall by a fifth in 2020 due to the coronavirus pandemic. Fuel supply (red) includes all investments associated with the production and provision of fuels to consumers, consisting mainly of oil, gas and coal investments. Power sector (blue) includes spending on power-generation technologies, grids and storage. Energy end use and efficiency (yellow) includes the investment in efficiency improvements across all end-use sectors. Source: IEA

These estimates are based on assumptions about the duration of lockdowns and coronavirus recovery trajectories.

The IEA notes that “almost all” investment activity has been disrupted by these measures, as a result of restrictions to the movement of people, goods and equipment. 

However, the largest impacts are the result of declines in revenues due to falling demand and prices, with the clearest example coming from the oil sector. Analysis of daily data until mid-April suggests countries in full lockdown have seen energy demand drop by a quarter.

As a result, the agency also estimates that these factors, combined with a rise in cases of people not paying their energy bills, will see revenues going to both governments and industry fall by over $1tn this year.

Crisis ‘accelerating’ shift from low-efficiency technologies

Every year energy infrastructure is retired and replaced with new equipment. Typically, the replacement technologies will be cleaner and more efficient, although this is not always the case. 

The coronavirus crisis is expected to have an impact on this rate of turnover and, indeed, it is already contributing to the retirement of some older power plants and facilities, as the chart below illustrates.
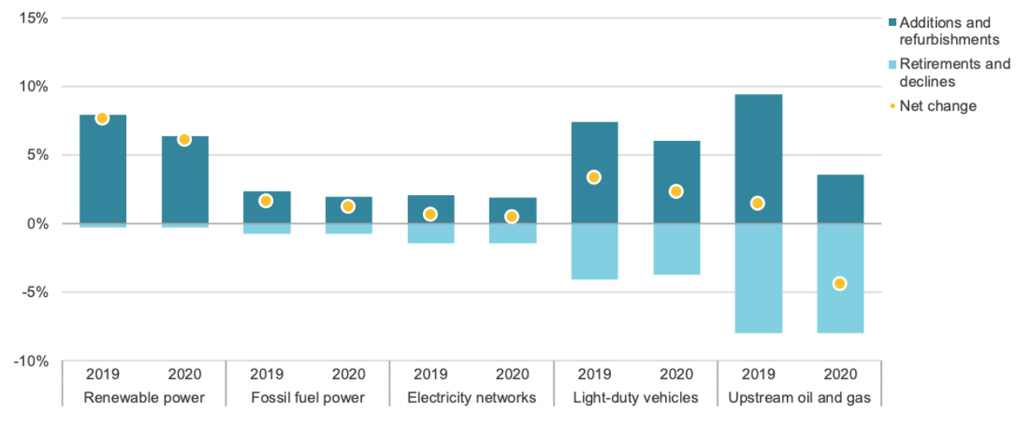
The Covid-19 crisis is hastening the retirement (light blue) of some older plants and facilities, but also impacting consumer spending on new and more efficient technologies (dark blue), with the potential for a net decrease (yellow dot) in upstream oil-and-gas facilities. Source: IEA.

The economic downturn and “surfeit of productive capacity in some areas” as overall demand plummets is already “accelerating” the closure and idling or inefficient technologies, including refineries and some coal-fired power plants.

However, the IEA warns that equally governments might respond to the pandemic by underinvesting in new technologies and remaining reliant on inefficient, older technology. The agency estimates efficiency investment could drop by 10-15% as spending is cut back.

The report warns that policymakers should keep these elements in mind and “combine economic recovery with energy and climate goals”. Dr Fatih Birol, executive director of the IEA, said in a statement that while the pandemic has brought lower emissions it has been “for all the wrong reasons”:

“The response of policymakers – and the extent to which energy and sustainability concerns are integrated into their recovery strategies – will be critical.”

Clean energy spending ‘relatively resilient’

The share of global energy spending going towards clean energy, including renewables as well as nuclear and efficiency improvements, has been flat-lining at around one-third for the past few years.

As the chart below shows, this is likely to change this year as clean energy’s share edges closer to two-fifths of overall spending.
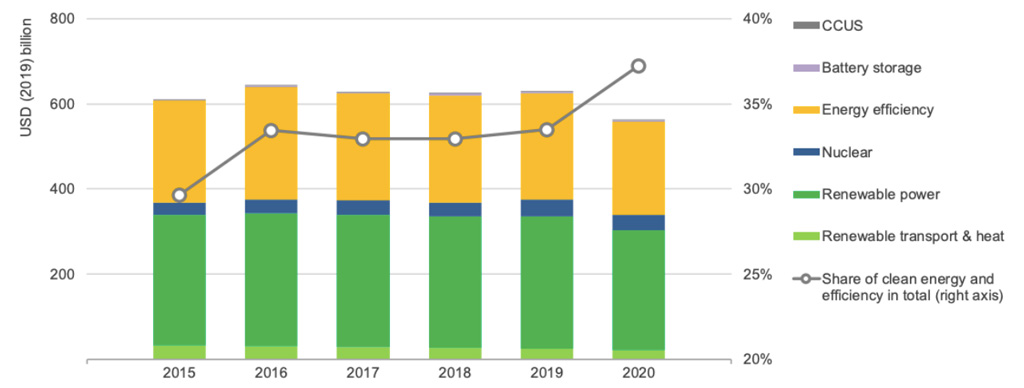
Breakdown of clean energy investment by sector in USD (left x-axis), with the % overall share (right x-axis) of spending indicated by a grey line. Source: IEA.

Clean energy investment is expected to remain “relatively resilient” this year, with spending on renewable projects falling by a comparatively small 10%. 

However, according to the IEA, the main reason for clean energy increasing its share is that fossil fuels are set to take such a “heavy hit”. In absolute terms, spending on these technologies is “far below levels” required to accelerate energy transitions.

The agency notes that investment trends have long been “poorly aligned” with the world’s needs and are still set to fall short of the future it has outlined in its benchmark Sustainable Development Scenario (SDS).

Last year’s edition of the World Energy Investment report concluded that investment in low-carbon energy sources must more than double by 2030 if the world is to meet its Paris Agreement targets.

While the slowdown in clean energy spending is less significant, it still “risks undermining the much-needed transition to more resilient and sustainable energy systems,” according to Birol.

Power sector hit hard

International power investment is set to drop by 10% as a result of the Covid-19 pandemic, according to the agency. 

Virtually every component of the sector is expected to see a decline in investment, with hydro the only exception, as the chart below demonstrates.
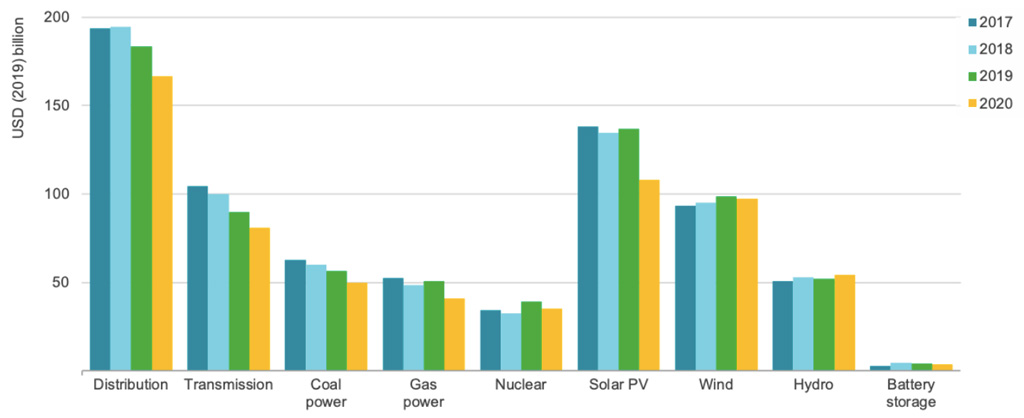
Global investment in the power sector by technology, with figures from the previous three years and estimates for 2020 (yellow). Source: IEA.

Increases in residential electricity demand around the world during lockdown are being “far outweighed” by reductions in commercial and industrial operations, the agency reports. A 9% decline in spending on electricity networks this year is also expected.

The IEA says some parts of power investment are more exposed, specifically fossil fuel-based generation. 

Meanwhile, higher shares of renewables are being dispatched due to low operating costs and priority access to networks. Nevertheless, renewables are still taking a hit, particularly distributed solar photovoltaics (PV) as households and companies cut back on spending.

Technologies with a longer lead time, notably offshore wind and hydropower, are expected to do better despite some delays.

Electricity spending pulls ahead of oil

Oil accounts for most of the decline in revenues expected this year. Furthermore, in a “historic switch” consumer spending on electricity could exceed spending on oil for the first time ever. 

While power-sector revenues are expected to fall by $180bn, oil spending will likely drop by at least $1tn. This can be seen in the chart on the left below. Taken together, investment in oil and gas is expected to fall by almost a third in 2020. 
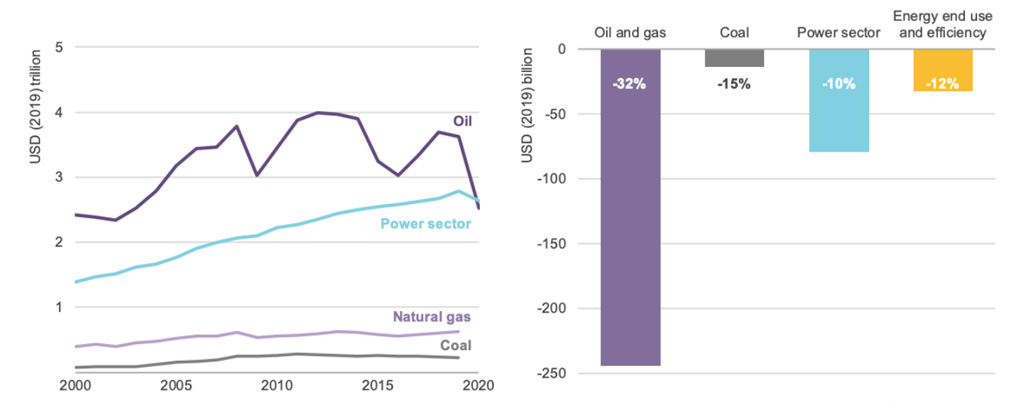
Both global end-use spending by consumers on energy (left) and estimated 2020 investment compared to 2019 show oil is expected to see the biggest decline in investment activity this year. Source: IEA.

The decline in aviation and road transport, which represent nearly 60% of oil demand, are responsible for this disproportionate decline.

Meanwhile, the impact on gas has so far been more moderate, but could fall further due to reduced demand in power and industry settings.

The report also highlights the global shale sector, which was already under pressure, as being particularly vulnerable. 

With investor confidence and access to capital in decline, the IEA predicts shale investment will halve in 2020 and notes the outlook for “highly leveraged shale players in the US” is now “bleak”.

Coal decline given a ‘floor’ by China

Coal is estimated to be the fuel hardest hit by the crisis after oil. Coal demand could drop by 8% this year, investment in coal supply is set to fall by a quarter and spending on new coal-fired plants is set to fall by around 11%.

However, any decline in coal’s fortunes may be curtailed by the recovery of demand for the fossil fuel in China. According to the IEA, investment activity there “may put a floor” under further reductions in coal-power investment this year.

The nation’s focus on coal is illustrated in the chart below, which shows final investment decisions (FIDs) dropping to their lowest levels in a decade, but China providing virtually all of them in the year so far.
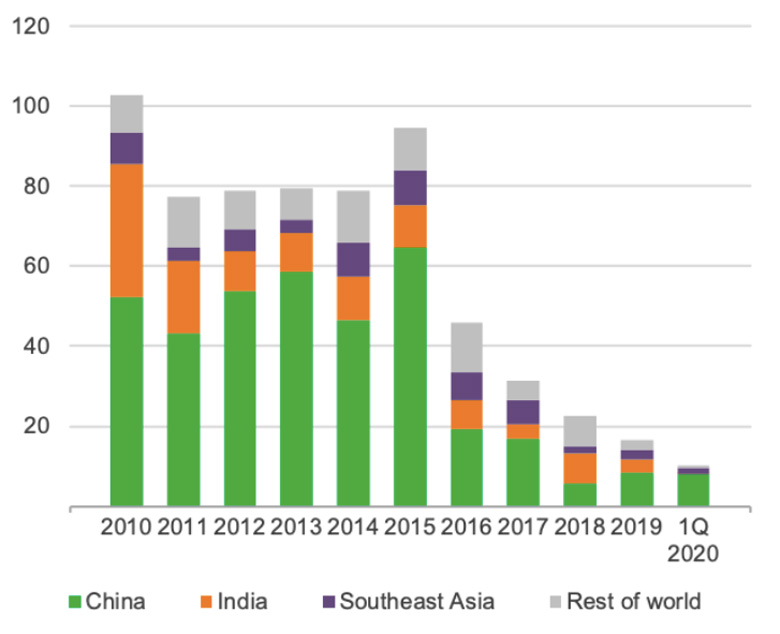
Coal-fired power generation capacity (GW) subject to a final investment decision (FID), with China coloured in green. Source: IEA.

Using data available so far, the IEA notes that approvals for new coal plants in the first quarter of 2020, were “running at twice the rate observed over 2019 as a whole”, primarily in China.

Electric vehicle sales rising as overall market contracts

Last year was a difficult time for the car industry, with total sales growth slowing in all major regions and turning negative in China and the US.

However, this “turbulent” period for the industry is “likely to appear mild” in comparison with 2020, according to the IEA. 

Lockdowns have already severely impacted sales and, across the year, the agency estimates a drop of around 15% – dramatic even compared to the 10% drop that followed the 2008 financial crisis. Negative trends in overall car sales can be seen in the right-hand chart below.
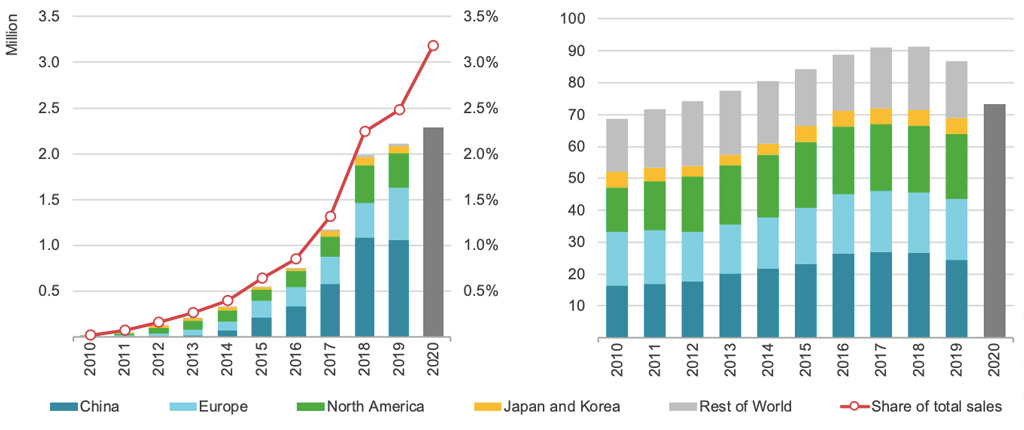
Global sales of electric passenger vehicles – cars, vans and small trucks – and market share, indicated by a red line (left chart). Total light-duty vehicle sales (right). Source: IEA.

However, even though electric vehicle sales followed wider patterns and stalled in 2019 largely due to declining Chinese purchases, their overall market share continued to climb. 

This can be seen in the chart on the left, which shows that electric cars are expected to go against the broader trend in 2020. The IEA estimates that owing to policy support, particularly in Europe, electric vehicle sales will increase this year, as will their share of the market (indicated by the red line).

Battery storage spending fell as prices dropped

Investment in battery storage fell for the first time last year, as the chart below shows. Overall, spending on grid-scale and behind-the-meter batteries fell by 15%, with overall investment just above $4bn.
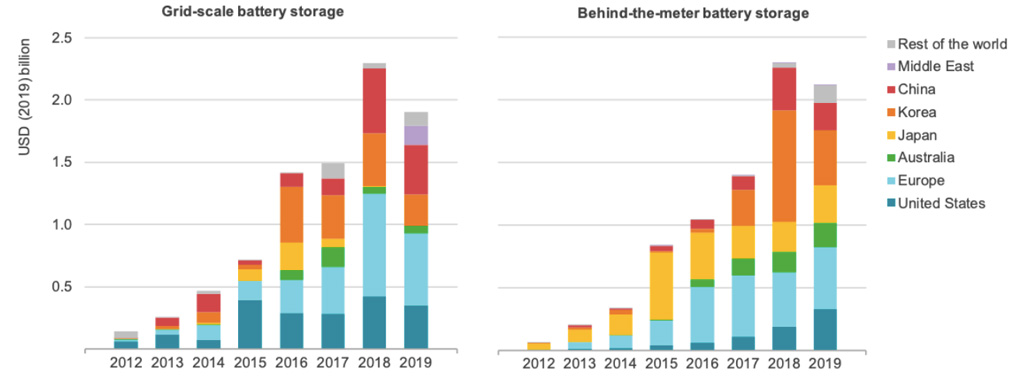
Investment in both grid-scale (left) and behind-the-meter battery storage (right). Source: IEA.

The IEA states this decline took place as costs for battery storage fell rapidly, a trend the agency attributes to maturing supply chains and markets, more efficient production and competition within the sector.

The report mentions fires at energy storage installations in South Korea and regulation uncertainty in China as some of the factors behind the decline in interest last year.

Declining behind-the-meter battery spending also reflects the distributed solar PV market, for which investment slowed last year in a trend expected to continue as consumer spending drops off due to coronavirus.

The agency notes that grid-scale battery investments are also expected to decline this year against the backdrop of a general decrease in power activity. 

However, it says this setback “is likely to be shortlived” due to the technology’s growing importance for system security and flexibility. 

***

IEA: Coronavirus ‘accelerating closure’ of ageing fossil-fuelled power plants

Josh Gabbatiss, Carbon Brief, 27 May 2020

Published under a CC license. Carbon Brief welcomes the reproduction of unadapted material in full for non-commercial use, credited ‘Carbon Brief’ with a link to the article.

art, the built environment, & the Bizot Green Protocol

Works of art. History. Cultural heritage. The market. Galleries. Art fairs. Museums. Private museums. Institutional and private collections. Fiduciary care. Value.

Let’s consider a pressing issue:

How collections are housed, managed, and cared for and the protection of works of art and tangible assets in an age of increasingly erratic weather, increasing sea-level rise, floods, fires, storms, … and pandemics – which in themselves and the response to which can be devastating.

Does one barricade the art behind flood walls and barriers? Insure the works of art? (Insurance is a good idea. Insurance does not, however, mitigate or prevent future damage. Insurance is used to protect the “value” of the art, not the work of art itself. It is used after damage occurs to recover value.)

Can we protect works of art while mitigating possible future damage?

Atmospheric CO2 is a key factor leading towards the storms, floods, and fires that can be so damaging to art and tangible assets. Is it possible to care for our collections while reducing emissions of CO2 into the air?

The Bizot Group of museum directors, or the International Group of Organizers of Large-scale Exhibitions, thinks so.

Max Hollein, now the Director of New York’s Metropolitan Museum of Art, was Chairman of the Bizot Group in 2014. Richard Armstrong, Director of the Solomon R. Gugenheim Museum, and Glen Lowry, Director of the Museum of Modern Art, are members.

Wangechi Mutu (Kenyan, born Nairobi, 1972), “The Seated II” (bronze, 2019) situated in one of four niches in the facade of New York’s Metropolitan Museum of Art. Courtesy of the the artist, the Metropolitan Museum of Art, and Gladstone Gallery, New York and Brussels.


Wangechi Mutu (Kenyan, born Nairobi, 1972), “The Seated II” (bronze, 2019). Courtesy of the the artist, the Metropolitan Museum of Art, and Gladstone Gallery, New York and Brussels.

Axel Rüger, Director of the Van Gogh Museum in Amsterdam from 2006 until June of 2019 when he left the Van Gogh Museum to take up a new appointment as Chief Executive of London’s Royal Academy of Arts, is a member.

So are many others.

The Bizot Group agreed the Bizot Green Protocol in 2015:

The directors agree that museums can reduce the amount of CO2 emissions they are responsible for while recognizing their duty of care to collections:

1.  Guiding Principles
Museums should review policy and practice, particularly regarding loan requirements, storage and display conditions, and building design and air conditioning systems, with a view to reducing carbon footprints.

Museums need to find ways to reconcile the desirability of long-term preservation of collections with the need to reduce energy use.

Museums should apply whatever methodology or strategies best suit their collections, building and needs, and innovative approaches should be encouraged.

The care of objects is paramount. Subject to this,

environmental standards should become more intelligent and better tailored to specific needs. Blanket conditions should no longer apply. Instead conditions should be determined by the requirements of individual objects or groups of objects and the climate in the part of the world in which the museum is located;

where appropriate, care of collections should be achieved in a way that does not assume air conditioning or other high energy cost solutions. Passive methods, simple technology that is easy to maintain, and lower energy solutions should be considered;

natural and sustainable environmental controls should be explored and exploited fully;

when designing and constructing new buildings or renovating old ones, architects and engineers should be guided significantly to reduce the building’s carbon footprint as a key objective;

the design and build of exhibitions should be managed to mimimise waste and recycle where possible.

2.  Guidelines
For many classes of object containing hygroscopic material (such as canvas paintings, textiles, ethnographic objects or animal glue) a stable relative humidity (RH) is required in the range of 40 – 60% and a stable temperature in the range 16-25°C with fluctuations of no more than ±10% RH per 24 hours within this range. More sensitive objects will require specific and tighter RH control, depending on the materials, condition, and history of the work of art. A conservators evaluation is essential in establishing the appropriate environmental conditions for works of art requested for loan.

Environmental Sustainability – reducing museums’ carbon footprint,”National Museum Directors Council

See:

Environmental sustainability – reducing museums’ carbon footprint,” National Museum Directors Council

Wangechi Mutu: The NewOnes, will free us,” Metropolitan Museum of Art, The Facade Commission, 9 September 2019 – 9 June 2020

Wangechi Mutu, Gladstone Gallery

Axel Rϋger Appointed Chief Executive of London’s Royal Academy of Arts,” Artforum, 13 February 2019

Axel Rüger,” 40 Under 40 Europe 2018, Apollo Magazine, 3 September 2018

Groupe Bizot, Letter of 26 February 2014 to Mr. Mikhail Piotrovsky, Director, State Hermitage Museum, St. Petersburg, Russia

Daily global CO2 emissions ‘cut to 2006 levels’ during height of coronavirus crisis

Daily global CO2 emissions ‘cut to 2006 levels’ during height of coronavirus crisis

Simon Evans, Carbon Brief, 19 May 2020

***

The amount of CO2 being released by human activity each day fell by as much as 17% during the height of the coronavirus crisis in early April, a new study shows.

This means daily emissions temporarily fell to levels last seen in 2006, the study says. In the first four months of the year, it estimates that global emissions from burning fossil fuels and cement production were cut by 1,048m tonnes of CO2 (MtCO2), or 8.6%, compared with 2019 levels.

The research projects a decline of up to 2,729MtCO2 (7.5%) in 2020 as a whole, depending on how the crisis plays out. It is the first to have been through the peer-review process and is broadly in line with an early estimate for China published by Carbon Brief in February, as well as separate global estimates published last month by Carbon Brief and the International Energy Agency.

Today’s study also marks the first-ever attempt to quantify CO2 emissions on a daily basis, for the world and for 69 individual countries, in close to real time. Until now, annual CO2 emissions data has typically been published months or even years later.

A publicly available daily estimate of global or national CO2 emissions would be “incredibly useful, particularly for motivating policy action and pressure”, another researcher tells Carbon Brief.

Coronavirus crisis

The ongoing coronavirus crisis has claimed the lives of hundreds of thousands of people around the world and seen the introduction of severe restrictions on movement in many countries.

These lockdowns have included “stay at home” orders, border closures and other measures that have had direct effects on the use of energy and, consequently, on the release of CO2 emissions.

As the crisis has unfolded, so too have attempts to quantify its impact on CO2 emissions. These efforts have been challenging, however, because real-time CO2 emissions data does not exist.

The annual emissions inventories that countries submit to the UN take years to compile – and even these are estimates rather than direct measurements.

Greenhouse gas emissions are estimated using a variety of methods, often based on “activity data”. This might be the number of miles being driven, the amount of electricity generated or even – in the case of nitrous oxide, which is used as a propellant  – via cream consumption.

Today’s study, published in Nature Climate Change, combines activity data for six sectors with a “confinement index” of lockdown measures in each country or region over time.

This allows for an estimate of changes in daily global CO2 emissions in January-April 2020, relative to the 100MtCO2 released on an average day in 2019.

During peak confinement in individual countries, daily CO2 emissions fell by 26% on average, the paper says. However, the size of this effect is reduced at a global level, because not all countries were under the most severe type of lockdown at the same time.

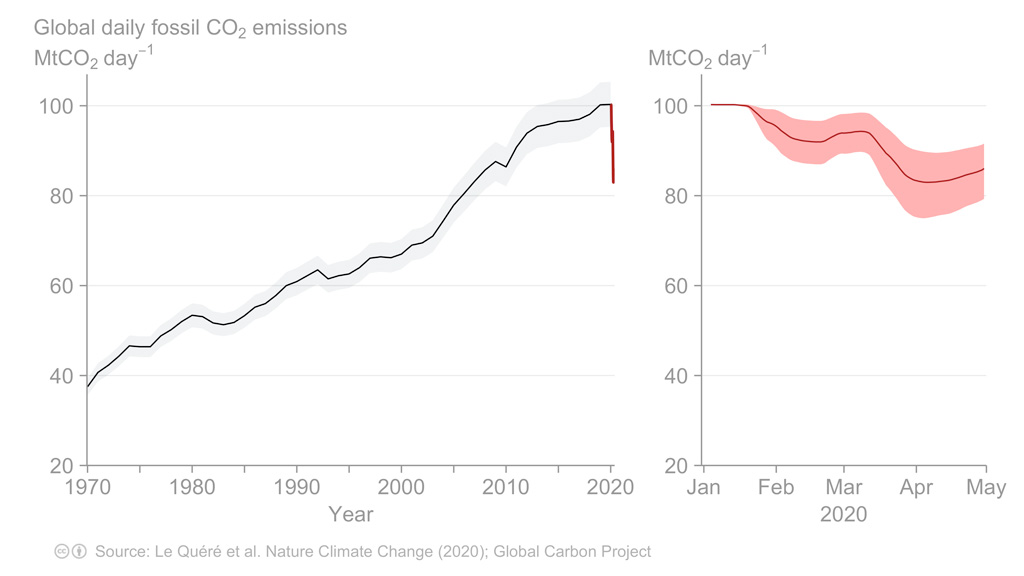
At the peak of the crisis in early April, regions responsible for 89% of daily CO2 emissions were under some form of lockdown, the paper says. Daily global CO2 emissions fell to 83MtCO2 (-17%, with a range of -11 to -25%) on 7 April, equivalent to levels last seen in 2006.

In a press release, lead author Prof Corinne Le Quéré, professor of climate change science at the University of East Anglia’s Tyndall Centre (who will be a panelist at Carbon Brief’s webinar on 21 May), says:

“Population confinement has led to drastic changes in energy use and CO2 emissions. These extreme decreases are likely to be temporary, however, as they do not reflect structural changes in the economic, transport, or energy systems.”

Daily data

In order to estimate daily global CO2 emissions, the researchers use a novel approach that combines sectoral activity data with a country-by-country confinement index.

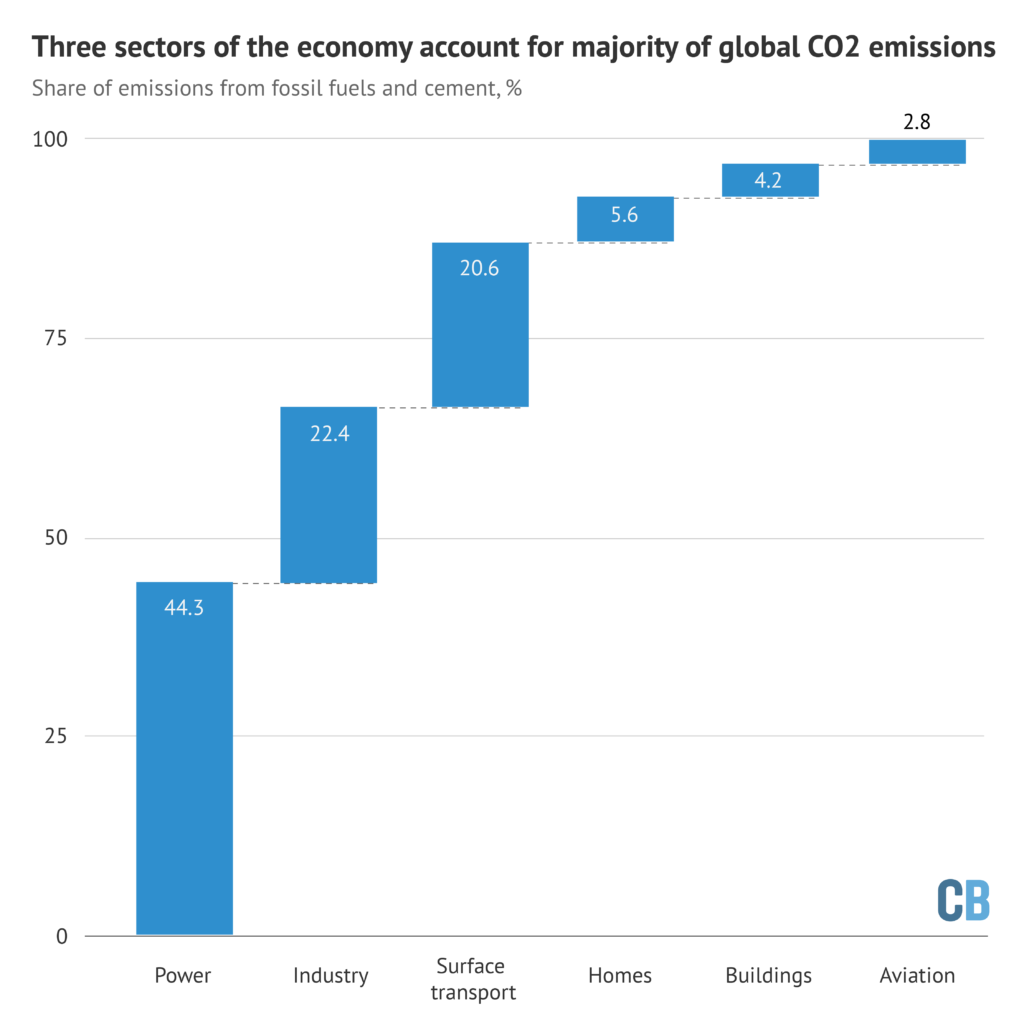
The paper looks at six sectors, shown in the chart below according to their share of global CO2 emissions from fossil fuels and cement. These are electricity and heat (44%); industry (22%); surface transport (20%); homes (6%); public buildings and commerce (4%); and aviation (3%).

Share of global CO2 emissions from fossil fuels and cement due to each of six sectors of the economy. Source: Le Queré et al. (2020). Chart by Carbon Brief.

Notably, this split highlights the limited potential for individual actions to radically reduce global emissions, in contrast to the societal choices that govern CO2 from electricity and industry.

The split in global CO2 emissions, shown above, is then broken down further for each of 69 countries, 50 US states and 30 Chinese provinces, which account for 97% of the global total. This gives industrial CO2 emissions in Italy, for example, on an average day in 2019.

The paper then uses 669 datasets, covering each of these sectors over time, and classified according to the level of confinement in place at each point. For example, this might be daily reports on mobility, traffic and congestion to measure “activity” for surface transport.

This daily data is then adjusted to remove effects unrelated to coronavirus, such as the mild northern hemisphere winter or the day of the week.

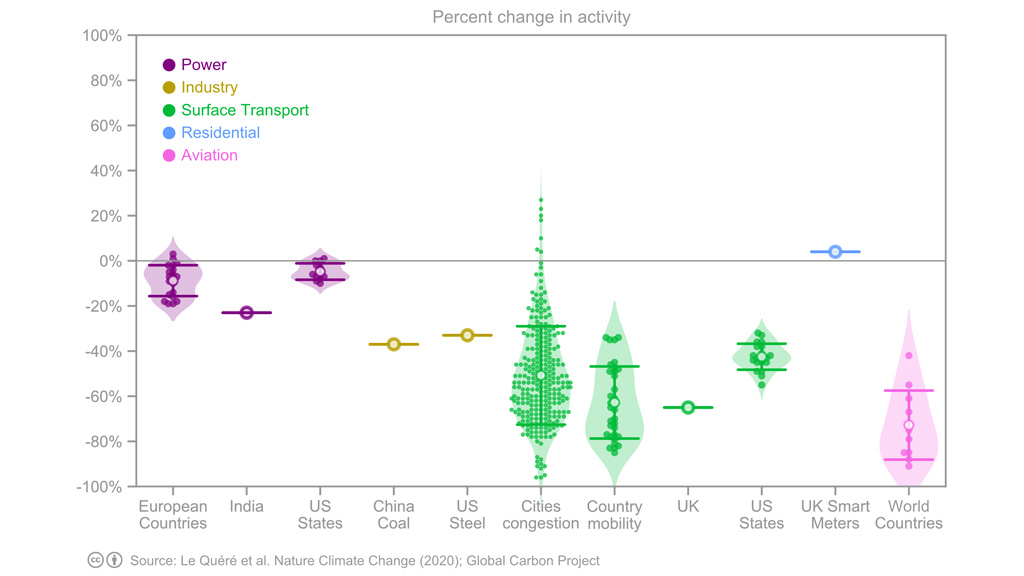
Under the highest level of confinement, surface transport “activity” fell by 50% on average, the paper finds. This is shown in green in the chart, below, where each dot represents a single data point, open circles show the average and the horizontal lines show the variability between datasets. The chart also shows changes in activity for electricity, industry, homes and aviation.

Change in sectoral “activity” under the highest level of coronavirus confinement, percent, relative to an average day in 2019. Each dot represents a single datapoint and open circles show the average. Reading from left to right, the chart shows activity changes in the power sector (purple), industry (yellow), surface transport (green), homes (blue) and aviation (pink). Source: Le Queré et al. (2020).

For electricity, the paper looks at total daily demand in Europe, the US and India, finding an average 15% reduction in demand under strict lockdown. In industry, the paper looks at daily coal use in China reported by Carbon Brief and weekly reports on steel production in the US.

For homes, the paper draws on figures from UK smart meters. And for aviation – the most strongly affected sector – it uses data on domestic and international departures around the world.

As the chart above shows, the analysis relies on relatively sparse information for industry, whereas activity levels in transport draw on a wider range of datasets.

Emissions estimates

The team then uses the average change in activity, for each sector and level of confinement, to build up an estimate of daily CO2 emissions around the world.

For example, on days when Turkey is under the strictest lockdown, the analysis assumes that its power-sector CO2 emissions would fall by 15% compared with the average in 2019 – and those from surface transport by 50%.

When Turkey shifts from “confinement index three”, the strictest controls, down to level two, its power-sector emissions would be 5% below usual levels and transport 40% lower. For each confinement level, the same percentage reductions are assumed to apply to all countries.

This approach means that the team only needed to know when each country, state or province changed its coronavirus lockdown from one “confinement level” to another, as well as the daily average level of CO2 emissions from each sector in 2019.

Putting all of these countries and lockdown levels together, the paper finds that the cut in daily global CO2 emissions peaked at -17% on 7 April, shown in the figure, below. Across the first four months of 2020, emissions fell by 1,048MtCO2 (8.6%), compared with 2019 levels.

Estimated daily global CO2 emissions from fossil fuels and cement, million tonnes (MtCO2 per day). The left panel shows emissions from 1970-2020 and the right panel shows the first four months of 2020. Source: Le Queré et al. (2020).

Within this global total, the largest impacts were in China, where emissions fell by an estimated 242MtCO2 in the first four months of the year, followed by the US (-207MtCO2), Europe (-123MtCO2) and India (-98MtCO2).

Dr Glen Peters, research director at Norwegian climate institute Cicero and one of the study authors, tells Carbon Brief that while the approach was designed around the current crisis, the team has gathered the “raw material” to make daily CO2 estimates on an ongoing basis. He says:

“We have discussed more ‘real-time’ estimates for sometime and there are many advantages. We are illustrating one advantage with our paper to see the consequences of particular policy interventions in near real time.”

But Peters notes that some of the daily data they used – the urban congestion index series from satnav maker TomTom, for example – is only being made publicly available during the current crisis and might be made private again in the future. He also asks whether daily data is truly needed, or whether weekly or even monthly estimates might be sufficient for scientists and policymakers.

Dr Hannah Ritchie, head of research at website Our World in Data and one of the reviewers of the new study, tells Carbon Brief:

“I think daily CO2 estimates would be incredibly useful, particularly for motivating policy action and pressure…Climate change already has the classic long-termism problem, but this is exacerbated by the fact that we get a figure on CO2 emissions published once a year, as a marker of how each country is doing.”

If daily CO2 estimates were publicly available for all countries, it would become possible to actively track progress, she says, adding: “You can have a counter on the news, or an app or dashboard on your phone – just like we do with other metrics like stock markets.”

Alternative analyses

Today’s research is not the first to analyse the CO2 impacts of the coronavirus crisis, although it is the first to have completed its passage through peer review.

Another paper, which is currently in review, also attempts to estimate daily global CO2 emissions in close to real time. This work finds the coronavirus crisis cut global emissions by -542MtCO2 below 2019 levels in the first quarter of 2020, similar to the -530MtCO2 figure from today’s paper.

In mid-February, Carbon Brief published an analysis showing that emissions in China were temporarily cut by 200MtCO2 (25%) over a four-week period, during the height of the restrictions. The new study finds that the cut in Chinese emissions peaked at 24%.

Today’s research also includes estimates of the emissions impact in 2020 as a whole, based on three scenarios for the length of lockdowns around the world. These entail CO2 emissions falling by between -4% and -8%, depending on how the crisis plays out. This range is consistent with estimates published in April byCarbon Brief (-6%) and the International Energy Agency (-8%).

***

Daily global CO2 emissions ‘cut to 2006 levels’ during height of coronavirus crisis

Simon Evans, Carbon Brief, 19 May 2020

Published under a CC license. You are welcome to reproduce unadapted material in full for non-commercial use, credited ‘Carbon Brief’ with a link to the article. 

inflection point? · oil major tears up the industry’s financial playbook

In August 2014 Simon Evans of Carbon Brief, reporting on a white paper, “Fossil fuel divestment: a $5 trillion challenge,” published days earlier by Bloomberg New Energy Finance, noted that “‘fossil fuels are investor favourites for a reason’….fossil fuel investments have a history of strong performance.

BNEF looked at seven alternative trillion-dollar sectors and found that only shares in real estate firms have paid higher dividends in recent years than fossil fuel firms.”

(Simon Evans, “Why fossil fuel divestment won’t be easy,” Carbon Brief, 27 August 2014)

Fast forward to today. Due to the impact of the Covid-19 pandemic, global energy demand in the first quarter of 2020 was 3.8% lower than in the same quarter of 2019. The IEA expects global energy demand for 2020 to decline by 6% year-on-year, a decline not seen for decades.

Annual rate of change in primary energy demand, %, since 1900, with key events impacting demand highlighted. Source: Josh Gabbatiss, “IEA: Coronavirus impact on CO2 emissions six times larger than 2008 financial crisis,” Carbon Brief, 30 April 2020; IEA Global Energy Review

The fossil fuel sector, consistently a source of large dividends over the years, is suddenly under market stress and scrutiny from investors.

While “most analysts expected the world’s largest Western super majors … to defend their dividend at almost any cost given how important the payouts are to North American investors” (Kevin Crowley, Exxon Freezes Dividend for First Time in 13 years Amid Crash, Bloomberg, 29 April 2020), Royal Dutch Shell, Europe’s largest oil company, shocked the investing world.

Shell both reduced its dividend, the first time it has done so since World War II, for Q1 2020 and, observing that it would be neither “wise” nor “prudent” nor “responsible” to do so, announced it will not follow industry practice of borrowing against its balance sheet to finance the dividend payment.

The Board of Royal Dutch Shell plc (“RDS” or the “Company”) today announced an interim dividend in respect of the first quarter of 2020 of US$ 0.16 per A ordinary share (“A Share”) and B ordinary share (“B Share”), reduced from the US$ 0.47 dividend for the same quarter last year.

The pace and scale of the societal impact of COVID 19 and the resulting deterioration in the macroeconomic and commodity price outlook is unprecedented. The duration of these impacts remains unclear with the expectation that the weaker conditions will likely extend beyond 2020.

“In response, Shell has taken decisive actions to reduce our spending and position our businesses to compete in the current lower commodity price environment and uncertain demand outlook.

“The Board of Royal Dutch Shell has taken the decision to reset its dividend to provide financial resilience and further flexibility to manage the uncertainty. Shell is taking the steps necessary to ensure that we are well-positioned for the eventual economic recovery.

(“Royal Dutch Shell plc first quarter 2020 interim dividend,” 30 April 2020)

Not only did the dividend reduction, coupled with CEO Ben van Beurden’s further announcement that Shell would not take on debt to fund its dividend payment, shock investors, it also “tore up the industry’s playbook.”

When the boss of Royal Dutch Shell Plc slashed his dividend on Thursday, he didn’t just shock investors,” Laura Hurst of Bloomberg commented, “he tore up the industry’s financial playbook.

For decades Big Oil has used the strength of a large balance sheet to borrow money when the going gets tough and keeps investors sweet until the next upward cycle.

As the coronavirus pandemic potentially causes lasting damage to energy demand, Europe’s largest oil company asked whether this strategy is sustainable.

“’I would say no,’ said Shell Chief Executive Officer Ben van Beurden. ‘It’s also not wise and prudent, nor even responsible, to pay out a dividend if you know for sure you have to borrow for it.‘”

(Laura Hurst, “Shell’s Dividend Cut Shows This Time is Different for Big Oil,” Bloomberg, 30 April 2020)

Norwegian multinational energy company Equinor (OSE:EQNR,NYSE:EQNR; formerly Statoil) announced on 23 April a cash dividend of US$ 0.09 per share for the first quarter 2020, a reduction of 67% compared to the dividend proposed for the fourth quarter 2019.  

On 28 April, BP announced an interim dividend of 10.50 cents per ordinary share for the first quarter of 2020.

Gaurav Sharma, Senior Contributor at Forbes, observing that whilst first quarter profits at BP have decreased by 67% on lack of oil demand and the crude oil price crash, the company “sprung a surprise for the market by maintaining the company’s 10.5 U.S. cents per share dividend payment, hiked by 2.4% as recently as February.”

The move,” Mr. Sharma noted, “will come as a relief to beleaguered U.K. income funds that have seen over $18.6 billion in payouts cancelled or suspended over the last six weeks.

Collectively, HSBC, GSK, Royal Dutch Shell, British American Tobacco and BP accounted for 40% of FTSE 100 dividend payouts in 2019. With BP promising to payout, HSBC holding back following regulatory pressure, GSK, BAT and Shell, which hasn’t failed to pay a dividend since the Second World War II, appear to be in the bag.”

(Gaurav Sharma, “Profits Slump 67% At BP But Oil Major Maintains Dividend Despite Coronavirus Downturn,” Forbes, 28 April 2020)

On 29 April, Exxon Mobil Corp., based in Irving, Texas and the largest oil company in the Western Hemisphere, announced that for the second quarter 2020 it will pay a dividend of 87 cents per share. This is the same amount that was paid per share for the first quarter of 2020.

For the first time in 13 years, ExxonMobil “froze” its second quarter dividend to the amount paid in the first quarter.

Kevin Crowley of Bloomberg notes “Before now, Exxon had an uninterrupted streak of April increases going back to 2007.”

Most analysts expected the world’s largest Western super majors, including Exxon, to defend their dividend at almost any cost given how important the payouts are to North American investors. Before today, Exxon was the third-largest dividend payer in the S&P 500 Index behind Microsoft Corp. and AT&T Inc., according to data compiled by Bloomberg.”

The freeze may not derail Exxon’s multi decade streak of annual increases,” Mr. Crowley continues. “Even if the company maintains quarterly payouts at the current level for the rest of 2020, the annual outlay will be $3.48 a share, or 1.5% above 2019.

“’It’s definitely a sign of the times and to be expected given the price environment,’ said Jennifer Rowland, an analyst at Edward D. Jones &Co. The payout is “secure” because the company has capacity to take on debt to fund it, she said. On an annualized basis, the dividend will cost Exxon almost $15 billion this year.”

(Kevin Crowley, Exxon Freezes Dividend for First Time in 13 years Amid Crash, Bloomberg, 29 April 2020)

See:

Josh Gabbatiss, “IEA: Coronavirus impact on CO2 emissions six times larger than 2008 financial crisis,” Carbon Brief, 30 April 2020

First Quarter 2020 Interim Dividend,” Royal Dutch Shell Plc, 30 April 2020

Laura Hurst, “Shell’s Dividend Cut Shows This Time is Different for Big Oil, ” Bloomberg, 30 April 2020

Dividend Information, ExxonMobil dividends per common share,” Exxon Mobil, 29 April 2020

Kevin Crowley, “Exxon Freezes Dividend for First Time in 13 years Amid Crash,” Bloomberg, 29 April 2020

BPp.l.c. Group results, First quarter 2020“, 28 April 2020

Gaurav Sharma, “Profits Slump 67% At BP But Oil Major Maintains DividendDespite Coronavirus Downturn,” Forbes, 28 April 2020

Equinor reducing quarterly cash dividend for first quarter 2020 by 67%,” Equinor, 23 April 2020

Mikael Holter, “Norway Oil Giant Slashes Dividend to Weather Oil-Market Crash,” Bloomberg, 23 April 2020

Financial Times, “Shell dividend cut puts Big Oil investment case in focus” 

Simon Evans, “Why fossil fuel divestment won’t be easy,” Carbon Brief, 27 August 2014

Nathaniel Bullard, “Fossil fuel divestment: a $5 trillion challenge,” White Paper, Bloomberg New Energy Finance, 25 August 2014

art, philanthropy, energy: in transition

· renewable energy sources are set to account for nearly 21 percent of the electricity the United States uses for the first time this year, up from about 18 percent last year and 10 percent in 2010

· renewable energy provides 18% of total U.S. power generation, up from 10% in 2010

· corporate PPA’s for renewal energy accelerated from 0.1 GW in 2010 to33.6 GW by year-end 2019, with a record breaking 13.6 GW in 2019 alone.

· the carbon intensity of the power sector continues to decline. From 2010 to 2019, power sector emissions fell nearly 25%

· total U.S. greenhouse gas (GHG) emissions have fallen 4.1% over thepast decade, and now sit at roughly 12% below 2005 levels

2020 Sustainable Energy in America Factbook”, produced for the Business Council for Sustainable Energy by BloombergNEF

Art, philanthropy, energy. The relationships between them have history. As the way we generate energy evolves, the relationships between art, philanthropy, and energy will, in all likelihood, evolve as well.

Yves Tanguy (French, 1900-1955), “What” (oil on canvas, 1940), in the collection of the Museum of Fine Arts, Houston. The Joseph and Sylvia Slifka Collection. Object Number: 2004.146

“Houston,” observed Gary Tinterow, Director of the Museum of Fine Arts, Houston, in 2019, “is a cultural capital largely thanks to the discovery of oil.” (Houston Chronicle)

Yet, the energy economy is shifting in Texas. Renewable energy constitutes an ever increasing percentage of energy produced and used in Texas. 

Texas, a competitive rather than regulated energy market, is first in the United States in wind power capacity and near to having the second-most capacity for solar PV after California.

Solar energy has a significant (“marvelous”) cost advantage over gas-fired power plants: the marginal cost of solar is zero. Texas is on course to build a quarter of the record new industrial-scale solar capacity being installed across the United States in 2020.

As the energy economy evolves, how will the philanthropy that supports so many museums and cultural institutions evolve?

Let’s begin our quest for understanding by taking a look at relationships between art, philanthropy, and energy. We’ll start by looking to Texas.

The U.S. state of Texas consumes the most electricity in the United States. Demand for energy in Texas has grown over five percent over the past five years even as it has declined nationwide (EIA as reported in the FT).

Adding solar power through the incentives of a competitive electricity market, Texas is near to having the second-most capacity for solar PV after California. Texas, further, now ranks first in the United States in wind power capacity.

Texas is home to the Museum of Fine Arts, Houston (MFAH). The MFAH is one of the largest museums in the United States. As of late 2011 it had the third-largest museum endowment.

The permanent collection of the MFAH consists of nearly 70,000 works from throughout the world, from antiquity to the present day (MFAH) .

Gary Tinterow, Director of the MFAH, grew up in Houston. He worked at New York’s Metropolitan Museum of Art for 28 years, serving from 2008 until his departure for Houston as chairman of the department of 19th-century, modern and contemporary art. Mr. Tinterow’s appointment as Director of the MFAH was finalized by the museum’s board of trustees in late November 2011. He started his new position in early 2012.

Richard D. Kinder, co-founder (February 1997) and now Executive Chairman of Kinder Morgan, Inc., one of North America’s largest energy infrastructure companies, serves as Life Trustee of the museum and Chairman of the Board of Trustees. Mr. Kinder served as chairman of the museum’s search committee that identified Mr. Tinterow as a candidate for the directorship of the museum.

The business of Kinder Morgan is involved primarily with oil, gas, and petroleum products. Kinder Morgan “owns an interest in or operates 83,000 miles of pipelines and 147 terminals. The company’s pipelines transport primarily natural gas, refined petroleum products, CO2 and crude oil and its terminals store, transfer and handle such products as gasoline, ethanol, coal, petroleum coke and steel.” (Kinder Morgan)

Mr. Kinder commended Mr. Tinterow: “Gary’s passion for the job and his encyclopedic knowledge were what convinced us. He has so many good ideas, and there is so much potential to make this one of the outstanding museums of the world.” (NYTimes)

For his part, Mr. Tinterow explained, “As sorry as I will be to leave the Met after 28 years, I think I’ve landed the best job in the world. It’s a matchless combination: a committed board, a passionate audience, a fine collection and an institution with the third-largest endowment in the country.” (NYTimes)

Mr. Tinterow observed that the endowment of the Museum of Fine Arts, Houston stood at $1 billion in December 2011 after the J. Paul Getty Trust in Los Angeles, which oversees the J. Paul Getty Museum (endowment: $4.8 billion) and the Metropolitan Museum of Art, New York (endowment: $2.6 billion).

Asked in June 2019 after the relationship of the museum to energy companies and oil, Mr. Tinterow replied that he has “enormous respect for the energy industry.”

“Houston,” he continued, “is a cultural capital largely thanks to the discovery of oil.” (Houston Chronicle)

Indeed.

As of June 30, 2018, the Kinder Foundation had donated more than $50,000,000 to the Campaign for the Museum of Fine Arts, Houston (“The Museum of Fine Arts, Houston, Annual Report 2017 – 2018,”p. 17). This followed $50+ million reported by the museum as donated by the Foundation to the capital campaign as of the years ending June 30, 2017, June 30, 2016, and June 30, 2015.

The Nancy and Rich Kinder Building, dedicated to art after 1900 from the MFAH collections, is scheduled to open in November 2020. Consisting of two floors and more than 100,000 square feet of exhibition space,the building will increase overall MFAH exhibition space by nearly 75%. (MFAH)

While the MFAH has benefited, and continues to benefit, from the business of oil, the mix of Texas energy is changing.

First in the United States in wind power capacity and near to having the second-most capacity for solar PV after California, Texas will build a quarter of the record new industrial-scale solar capacity being installed across the US in 2020 (EIA, FT).

The cost of solar has plummeted, with the average industrial-scale PV project just $0.80 per installed watt last year compared to $3.53/Win 2010, according to the “2020 Sustainable Energy in America Factbook”, produced for the Business Council for Sustainable Energy by BloombergNEF, that looks at the U.S. energy transition over the decade 2010 – 2020.

Solar has a significant cost advantage over gas-fired power plants. The marginal cost of solar is zero. “The key thing is they have a magnificent cost advantage over gas-fired power plants,” observes Edward Hirs, energy fellow at the University of Houston. “The marginal cost of solar is zero.” (FT)

Investors in renewable energy, with time horizons of more than a decade, moreover, like the stable returns of projects backed by long-term contracts. (FT)

Corporations are taking advantage of falling costs to sign long-term solar power purchase agreements. Of the record 13,600MW of clean energy deals that companies completed in the US in 2019, 5,500MW of deals were generated in Texas. The majority of the deals closed were based on solar energy according to the “2020 Sustainable Energy in America Factbook”.

Google, for instance, is committing to buy power from Texas solar plants.

Neha Palmer, Google’s director of operations and head of energy strategy, observes that “[Texas] is a large, deregulated market. Users of electricity have a choice in who they buy electricity from and the type of energy that they buy. I think that’s been another driver of the large uptake of renewables in the state.”

The solar energy travels from the Permian Basin in west Texas, where much of the investment in solar energy is taking place, to cities such as Dallas and Houston aided by special transmission lines. The state of Texas authorized the lines 15 years ago. Designed to handle wind power, they are now enabling the flow of solar also.

Largely disconnected from the interstate transmission networks to the east and west of Texas, the grid is exempted from federal oversight. It is operated by the non-profit body Ercot (Electric Reliability Council of Texas.

“The Ercot power market is designed to be the ultimate competitive market,” Mr Archer says. Chris Archer, head of Americas at Macquarie’s Green Investment Group, a solar and wind developer with projects in Texas.

“Generators are only paid for the energy that they sell, not for having capacity at the ready. Wholesale prices that average about $40 per megawatt-hour are allowed to climb as high as $9,000 per MWh when demand surges on the hottest afternoons, a potential windfall for generators. Solar farms’ output crests when the sun is highest, enabling them to participate in these sales.” (FT)

As renewables grow as a percentage of the energy mix in Texas, and elsewhere, we will follow the evolution of the relationship between art, philanthropy, and energy.

See:

Ivan Penn, “Oil Companies Are Collapsing, but Wind and Solar Energy Keep Growing,” The New York Times, 7 April 2020, updated 8 April 2020

Gregory Meyer, “Texas: how the home of US oil and gas fell in love with solar power,” Financial Times, 7 April 2020

2020, Sustainable Energy in America Factbook, Understanding the U.S. EnergyTransition,” the2020 edition of the Sustainable Energy in America Factbook – produced for the Business Council for Sustainable Energy by BloombergNEF

The Museum of Fine Arts, Houston, Annual Report 2017 – 2018

Richard D. Kinder, Kinder Morgan

Erin Douglas, “Museum of Fine Arts Houston director putting final brushstrokes on $450 million expansion,” Houston Chronicle, 7 June 2019

Carol Vogel, “Met Veteran Named Director of Houston Art Museum,” TheNew York Times, 1 December 2011

Stephanie Cash, “Gary Tinterow leaves the Met for Houston,” artnews.com, 1December 2011

Business Council for Sustainable Energy

BloombergNEF (Bloomberg New Energy Finance)

coronavirus, climate change, the environment, & the arts: positive steps forward

“To my mind, one does not put oneself in place of the past; one only adds a new link.”

 Cy Twombly, quoted by Gagosian

“an elemental Dionysian force of madness rising, like a ‘fire that rises from the depths of the sea'”

Malcolm Bull, “Fire in the Water,” in Cy Twombly Bacchus Psilax Mainonmenos, exh. cat., New York, 2005, p. 55), quoted in Lot Essay, Cy Twombly (1928-2011), “Untitled” (acrylic on canvas, painted in 2005), Christie’s, Post-War & Contemporary Art Evening Sale, New York, 15 November 2017, Lot 15 B

Cy Twombly (1928-2011), “Untitled” (acrylic on canvas, painted in 2005). “Untitled” sold at the Christie’s Post-War & Contemporary Art Evening Sale of 15 November 2017 in New York realizing a price of US$ 46,437,500

Over ten feet high and sixteen feet in length, “Untitled” is the largest example from a group of giant-scaled paintings that Twombly created beginning in 2003 at age 75.

Twombly makes use of spirals of linear loops, culminating fifty years of regularly invoking scrawls, whirls, and writing/drawing.

In his catalogue essay, “Fire in the Water” that accompanied the first exhibition of Twombly’s Bacchus series in 2005, Malcolm Bull argued that the abiding theme of these paintings was that of an elemental Dionysian force of madness rising, like a “fire that rises from the depths of the sea” (M. Bull, “Fire in the Water,” in Cy Twombly Bacchus Psilax Mainonmenos, exh. cat., New York, 2005, p. 55).’ – Lot Essay

Like Dionysian forces of madness, we are all experiencing the dislocation caused by the current COVID-19 pandemic.  

Individuals, families, supply chains, industries, markets, businesses, nations – all are affected.

This pandemic, however terrible, unexpected, and unprepared for, may in part be an outcome of behaviors that we have, however unwittingly, engaged in over decades.

We are all – individuals, peoples, cultures, animals, plants, functional objects and works of art, buildings, systems of transportation, agriculture, and education, etc. etc. etc. – inextricably embedded in nature. We are part and parcel of and subject to the forces of physics. Part and parcel of and subject to the elements and interactions of chemistry. 

As living, breathing creatures, moreover, and complex systems of systems. we are part and parcel of and subject to the complex forces of biology.  We are calibrated precisely, over long periods of time, to our biosphere.

If and should we take our biosphere for granted, fundamentally alter the composition of our atmosphere, and tamper with our climate, the unexpected can occur. Mayhem may let loose,

And so it has.

Yet, in the arts we are global. We reach across time, across space, across borders, across cultures, across nations. We represent mind and passion, interests and preferences. We come from an abundance of backgrounds and industries. 

We may lead, each in our own place, taking steps to realize our ambitions anew.

Together we will have impact.

While we work in our many spheres of activity, what steps, however simple, might we take to realize our objectives while mitigating risks of future such dislocations?

If we want “to do something to prevent disease emergence, first of all we need to seriously reconsider how we do business with the biosphere.”

Q & A: A Harvard Expert on Environment and Health Discusses Possible Ties Between COVID and Climate,”

“We need to hear what nature is trying to tell us, which is clear: let’s be smarter about how we do business with the biosphere and stop disrupting the climate we depend on.” 

 Conversation on COVID-19 with Dr. Aaron Bernstein, Director of Harvard C-CHANGE

Two recently published articles are insightful. In them, Dr. Aaron Bernstein, MD, MPH, Director of The Center for Climate, Health, and the Global Environment at Harvard’s T.H. Chan School of Public Health (Harvard C-CHANGE) offers guidance.

Please take a few minutes to read them in full:

Neela Banerjee, “Q & A: A Harvard Expert on Environment and Health Discusses Possible Ties Between COVID and Climate,” Inside Climate News, 12 March 2020

A Conversation on COVID-19 with Dr. Aaron Bernstein, Director of Harvard C-CHANGE, ” Harvard C-CHANGE  

Excerpts follow, giving us some idea of what we probably already know but don’t always think about or consider in the decisions we make on a daily basis:

The bottom line here is that if you wanted to prevent the spread of pathogens, the emergence of pathogens, … you wouldn’t transform the climate.”

Q & A: A Harvard Expert on Environment and Health Discusses Possible Ties Between COVID and Climate,”

The separation of health and environmental policy is a dangerous delusion. Our health entirely depends on the climate and the other organisms we share the planet with.”

A Conversation on COVID-19 with Dr. Aaron Bernstein, Director of Harvard C-CHANGE

Simply put, “The likelihood is high that this [a next pandemic] will happen. This has happened through human history but the data we have shows that the pace is accelerating. That’s not terribly surprising. We’re living in highly dense urban places. Air travel is much more prevalent than it used to be. And climate is a part of what is fundamentally reshaping our relationship with the natural world.”

Q & A: A Harvard Expert on Environment and Health Discusses Possible Ties BetweenCOVID and Climate

You look at climate change, we have transformed the nature of the Earth. We have fundamentally changed the composition of the atmosphere, and, as such, we shouldn’t be surprised that that affects our health.”

If you look at the emerging infectious diseases that have moved into people from animals or other sources over the last several decades,the vast majority of those are coming from animals. And the majority of those are coming from wild animals. We have transformed life onEarth. We are having a massive effect on how the relationships between all life on Earth operate and also with ourselves. We shouldn’t be surprised that these emerging diseases pop up.

The principle is that we’re really changing how we relate to other species on Earth and that matters to our risk for infections.”

Q & A: A Harvard Expert on Environment and Health Discusses Possible Ties Between COVID and Climate”

Historically, we have grown as a species in partnership with the plants and animals we live with. So, when we change the rules of the game by drastically changing the climate and life on earth, we have to expect that it will affect our health.

A Conversation on COVID-19 with Dr. Aaron Bernstein, Director of Harvard C-CHANGE

How might we in our private and business capacities be smarter about how we do business with the biosphere and stop disrupting the climate we depend on?

First, think.

All industries, markets, and economies, including the arts, the art market, and the art economy, are interconnected and all are viable only within our shared biosphere.

“Art” is not self-existent. Art as a phenomenon, culture as a phenomenon, works of art, cultures, collections of works of art, collectors, and all parties to art are inextricably embedded in and dependent on nature.

Take time and steps to learn about and understand the biosphere. Take steps to reconsider how we, in every sphere of work and activity, do business with the biosphere.

We have an opportunity to consider ways to optimize connections, culture, art, the business of art, and the biosphere jointly.

Some simple steps that can be taken:

Minimize travel

Whether curator, museum director, staff, or trustee, collector, dealer, gallerist, advisor, interested party – vet travel requirements.

Minimize travel powered by combustion of hydrocarbons.

“We need to drastically decrease our greenhouse gas emissions from fossil fuels like coal, oil and natural gas.”

A Conversation on COVID-19 with Dr. Aaron Bernstein, Director of Harvard C-CHANGE

It goes without saying that travel by foot or by bike is encouraged. Travel by electric-powered cars, buses, and trains – especially insofar as the electricity is generated from renewable, non-hydrocarbon sources – is also encouraged.

Amsterdam-based art dealer Jan Six XI, for instance, bikes to and from work, and across town to consult with experts. (Russell Shorto, “Rembrandt in the Blood: AnObsessive Aristocrat, Rediscovered,” The New York Times Magazine, 27 February 2019)

Work with local partners

We are all somewhere. We do not need to be everywhere.

If you need to do work or close a transaction somewhere else, research, identify, vet, and work with local partners.

Optimize resources and connections made available online

Information, images, and opportunities to meet and discuss face-to-face, even in groups, abound online. As we are now seeing in abundance, education and research can be conducted online. Relationships developed through written and verbal communications optimized online, by mail (even mail that goes through the post office), and by telephone.

As much activity is migrating online, vet also your online service partners and their delivery options.

This website, for instance, is hosted by AISO.net. AISO.net is powered 100% by solar energy generated on site. The company does not make use of carbon credits. Members of staff are knowledgeable, of course, very personable, and extraordinarily helpful. They are great to work with.

Reduce carbon dioxide and greenhouse gas emissions from ongoing operations of physical plants

Galleries,museums, homes, businesses, offices, schools and universities, hotels,hospitals – all house works and collections of art.

Real-life steps can be taken to reduce use of hydrocarbon-based energy sources and achieve net-zero energy.

Expert and experienced stakeholders including architects, engineers, designers, builders, energy consultants, and sources of finance are able and ready to assist.

Information about service providers will follow.

Amsterdam’s Van Gogh Museum can serve as a model. The Van Gogh Museum operates 100% on renewable (wind)energy. (See Van Gogh Museum, sustainability, and accompanying infographic.)

Change habits of mind and behavior

Allow time for foot and bike travel. Schedule meetings and work requirements accordingly. 

Enjoy the great outdoors en route to work, home, meetings, and shopping.

Enjoy your locality

See:

Cy Twombly (1928 – 2011), “Untitled” (acrylic on canvas, painted in 2005), Christie’s, Post-War & Contemporary Art Evening Sale, New York, 15 November 2017, Lot 15 B 

Coronavirus, climate change, and the environment, A Conversation on COVID-19 with Dr. Aaron Bernstein, Director of Harvard C-CHANGE”, Harvard C-Change, 20 March 2020

Aaron Bernstein, MD, MPH, C-Change,Center for Climate, Health, and the Global Environment, Harvard T.H. Chan School of Public Health

Neela Banerjee, “Q&A:A Harvard Expert on Environment and Health Discusses Possible TiesBetween COVID and Climate,” Inside Climate News, 12 March 2020

Russell Shorto, “Rembrandt in the Blood: An Obsessive Aristocrat,Rediscovered,” The New York Times Magazine, 27 February 2019

Amazon selects New York & Arlington, VA for HQ2 ・people, mass transit, sustainability

Amazon has selected New York City (the Long Island City neighborhood of the borough of Queens) and Arlington,Virginia (the Crystal City neighborhood, across the Potomac from Washington, DC) for its HQ2.

In agreements with the local and state governments, Amazon stipulates that the two locations will house at least 25,000 employees each. The new sites will require $5 billion in construction and other investments.

Direct access to rail, train, subway/metro, bus routes (mass transit) at site has been a core preference of Amazon, stipulated in the Amazon HQ2 RFP.

Significantly, Amazon’s HQ2 RFP stipulates that it will develop HQ2 with a dedication to sustainability:

Sustainability: Amazon is committed to sustainability efforts. Amazon’s buildings in its current Seattle campus are sustainable and energy efficient. The buildings’ interiors feature salvaged and locally sourced woods, energy efficient lighting, composting and recycling alternatives as well as public plazas and pockets of green space. Twenty of the buildings in our Seattle campus were built using LEED standards. Additionally, Amazon’s newest buildings use a ‘District Energy’ system that utilizes recycled heat from a nearby non-Amazon data center to heat millions of square feet of office space – a system that is about 4x more efficient than traditional heating. This system is designed to allow Amazon to warm just over 4 million square feet of office space on Amazon’s four-block campus, saving 80 million kilowatt hours over 20 years, or about 4 million kilowatt-hours a year. We also invest in large solar and wind operations and were the largest corporate purchaser of renewable energy in the U.S. in 2016.

Amazon will develop HQ2 with a dedication to sustainability.

Of the cities selected, Emily Badger of The New York Times observes:

Tech companies feed on highly educated and specialized workers, specifically dense clusters of them where workers and companies interacting with one another are more likely to produce new ideas. Washington and New York, as it turns out, are two of the most highly educated regions in the country, with already large pools of tech workers.

Drop a big Amazon headquarters into Washington or New York, and economists expect the 50,000 workers there to be more productive than if the same 50,000 jobs were dropped into Indianapolis. Simply putting them in New York, near so many other tech workers, increases the likelihood that Amazon invents more services, connects to more markets, makes more money.

Those added benefits are so strong, economists say, that it’s worth it to companies like Amazon to pay more — a lot more — for office space and employee salaries in New York City.

‘If you are in the business of making new things — whether it’s a new product, or a new way of delivering things, or a new service — and it’s something that is unique, and it keeps changing and it needs updating, the most important factor of all is human capital,” said Enrico Moretti, an economist at the University of California, Berkeley. “It’s not like making soap, or like making textiles.’”

See:

Amazon HQ2 RFP

Amazon Announces New York and Virginia as HQ2 Picks,” Karen Weise, Technology | The New York Times, 13 November 2018

In Superstar Cities, the Rich Get Richer, and They Get Amazon,” Emily Badger, The New York Times, 7 November 2018

collections care & engineered resilience

As the markets for works of art, collections care, and engineered resilience in the built environment (private collections, museums – public and private, galleries, fairs, corporate and university collections, etc.) converge, renewable energy will be a factor.

“Underlying property increases in value by virtue of the fact that positive externalities associated with the performance of the resilience investments represents a superior outcome to the status quo – even when netted out by any costs.” (Keenan et.al.)

Companies have signed long-term contracts to purchase solar and wind energy in 28 markets.

Cost declines and efficiency improvements are making renewables cost-competitive with wholesale power prices of more traditional sources of electricity.

While larger corporations are entering into corporate power purchase agreements (PPA),

smaller companies are increasingly pooling electricity demand together to access economies of scale achieved through solar and wind projects.

This is called “aggregation.”

“Aggregation” might be a workable model for entities in the art market concerned about the long-term resilience of structures and care and value of works and collections.


See: 1) Jesse M. Keenan, Thomas Hill, Anurag Gumber, “Climate Gentrification: From Theory to Empiricism in Miami-Dade County,” IOPScience, 23 April 2018; 2) “Corporations Already Purchased Record Clean Energy Volumes in 2018, and It’s Not an Anomaly,” Bloomberg New Energy Finance, 9 August 2018


#art #artmarket #museum #privatemuseum #collection #contemporaryart #energy #co2 #wind #solar #renewableenergy #resilience #resilienceengineering #architecture #design #engineering #NewYork #Miami #LosAngeles #London #Paris #Amsterdam #Stockholm #Oslo #Berlin #Vienna #Dubai #HongKong #Shanghai #Beijing #Tokyo #Delhi #realestate

global investment in renewable energy & energy-smart technologies

Annual figures from Bloomberg New Energy Finance (BNEF) show that global investment in renewable energy and energy-smart technologies reached $333.5 billion last year, up 3% from a revised $324.6 billion in 2016, and only 7% short of the record figure of $360.3 billion, reached in 2015.

Chinese investment in all the clean energy technologies was $132.6 billion, up 24% setting a new record. The next biggest investing country was the U.S., at $56.9 billion, up 1% on 2016.

Solar led the way, as mentioned above, attracting $160.8 billion – equivalent to 48% of the global total for all of clean energy investment.

Wind was the second-biggest sector for investment in 2017, at $107.2 billion. Down 12% on 2016 levels.

The third-biggest sector was energy-smart technologies, where asset finance of smart meters and battery storage, and equity-raising by specialist companies in smart grid, efficiency, storage and electric vehicles, reached $48.8 billion in 2017, up 7% on the previous year and the highest ever.

See:

Runaway 53GW Solar Boom in China Pushed Global Clean Energy Investment Ahead in 2017” | Bloomberg New Energy Finance, 16 January 2018

#cleanenergy #renewableenergy #energy #finance #solar #wind #energy-smarttech #tech #investments #luxury #smartluxury  #realestate #commercialrealestate #resilience #CO2