A critical and public success upon completion, Harald Sohlberg’s “Winter Night in the Mountains” (Norwegian: “Vinternatt i fjellene”) was acquired by shipowner and collector Jørgen Breder Stang who donated the painting to Oslo’s National Museum (Norwegian: Nasjonalmuseet) in 1918.
Engaging the viewer in the captivating bluish moonlight over the mountains of Rondane, the painting is also known as “Winter Night in Rondane” (“Vinternatt i Rondane”).
Sohlberg (1869, Oslo – 1935, Oslo) began work on this painting in 1911. He completed it in 1914 in time for the Jubilee Exhibition of that year.
Note the cross shoveled out of the snow atop the peak to the right.
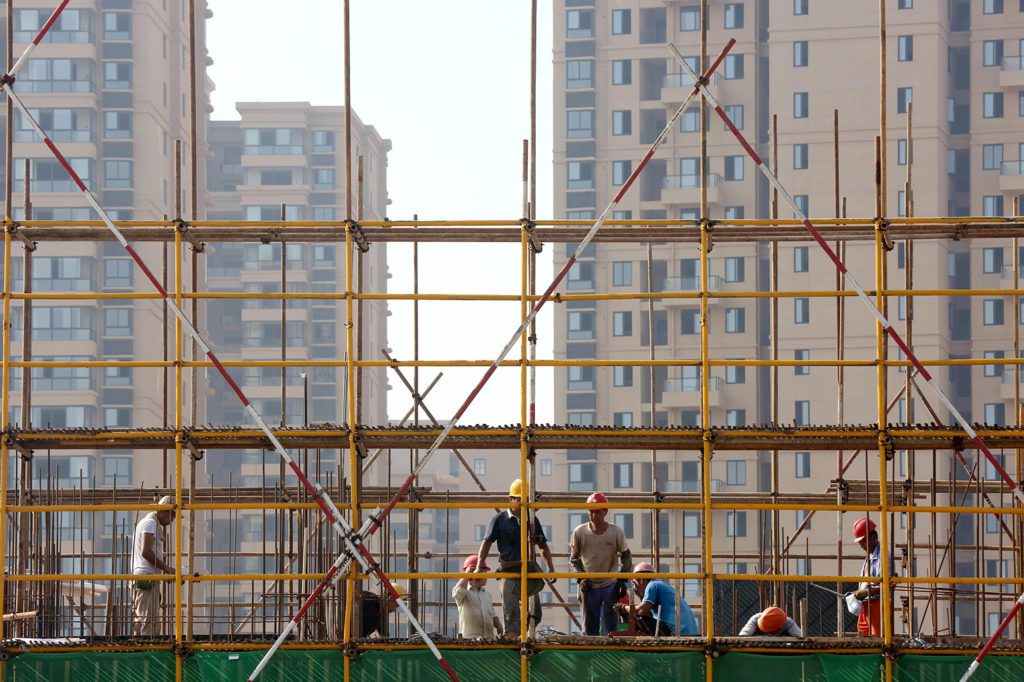
The construction and demolition of buildings in China was responsible for nearly a fifth of the nation’s annual CO2 emissions in 2015, according to a new study.
The world’s largest emitter has seen building rates soar as existing structures are torn down and replaced with skyscrapers to house the nation’s rapidly urbanising population.
All of this comes with a significant carbon footprint, both to produce the cement, steel and other materials required and from the emissions produced once the project is underway.
The researchers behind the new study, published in the Journal of Cleaner Production, say this has not received enough attention in China, despite being an “unignorable and critical” component of the nation’s emissions.
However, other academics Carbon Brief talked to said that while China’s construction “boom” is undoubtedly carbon-intensive, there are “issues” with the methods used in this analysis.
‘Construction fever’
A growing urban population and land scarcity have contributed to significant growth in construction – particularly of high-rise buildings – across China.
Since 2010, China has been responsible for around half of the world’s growth in construction, with many buildings only standing for around 30 years before being demolished.
Their construction, maintenance and demolition all come with a carbon cost. Previous studies have estimated that the energy consumption of China’s building sector has more than tripled since 2001.
Xinyi Shen from Greenpeace East Asia tells Carbon Brief that, given this, it is not surprising that China’s “construction fever” is a primary driver of its emissions.
However, in the new study, a team led by PhD candidate Weina Zhu of Tsinghua University, make the distinction between “operational” and “embodied” CO2 emissions, emphasizing the need to focus on the latter.
Embodied CO2 is defined in the paper as total emissions from “building materials manufacturing and transportation, building construction, maintenance and demolition”. Operational emissions are those arising from day-to-day energy use – for example, lighting, heating and cooling.
The authors say that operational carbon is generally assumed to be the primary contributor to the sector’s emissions, meaning strategies have focused on improving the energy efficiency of buildings.
However, they say that if China is to hit its climate target of peaking emissions in 2030, it will need to make embodied emissions a priority.
Time lapse showing the development that has taken place in Shanghai between 1984-2018. Source: Google Earth Engine
Bottom-up and top-down
The researchers looked at building activity throughout 2015, a year when Chinese economic stimulus – and the construction it helps drive – was reportedly at relatively low levels.
To estimate the embodied CO2 for construction that year – excluding civil engineering projects, such as bridges and roads – the researchers used two different approaches.
First, they used a process-based assessment. This was a “bottom-up” method that involved working out the total emissions of all the processes feeding into Chinese construction, from chemical reactions in cement factories to machinery used on building sites.
For the second assessment they used an input-output model. This was a “top-down” approach for which the team took national data and isolated the relevant components.
One of the paper’s co-authors, Dr Wei Feng, tells Carbon Brief this is “the first systematic analysis” of China’s embodied CO2 emissions using both of these methods.
Results based on the process approach showed that the embodied carbon in the Chinese building sector for that year was 1,422m tonnes of CO2 (MtCO2), while the input-output method settled on 1,600MtCO2.
Based on the upper estimate, they note this was approximately 18% of total Chinese emissions reported in 2015.
Residential buildings had around twice the emissions cost of non-residential buildings. The study notes how China’s housing has shifted from brick and wood to reinforced concrete and steel high-rise structures.
Crucially, the researchers say their estimate puts embodied CO2 roughly on a par with past estimates of operational CO2.
Dr Francesco Pomponi, an engineer at Edinburgh Napier University who was not involved in the study, tells Carbon Brief this seems more plausible than many other comparisons between operational and embodied CO2:
“Previous assessments we have had suggested 20% embodied, 80% operational or less than that, whereas this study is pointing towards a more realistic picture – about half and half.”
As a comparison, a report from last year by the World Green Building Council concluded 11% of annual global emissions were from carbon embodied in building construction processes. Nearly three times as much came from operational building emissions.
While around 10% of European states’ annual emissions can be traced to embodied building carbon, Pomponi says a value of roughly double this seems accurate for an economy such as China.
“I go every year so I see the difference year after year in how much built stock was added in 12 months,” he says.
‘Red flags’
However, Dr Jannik Giesekam, an industrial climate policy researcher at the University of Leeds who has worked extensively in this area but was not involved in the study, tells Carbon Brief he identified numerous “red flags” in the research.
While he thinks the researchers probably arrived at the right “ballpark figure”, he has “major” issues with the paper that he thinks compromise the results.
One of the key points he identified was that the paper overlooked a lot of pre-existing work on embodied carbon, including databases prepared by industry “in favour of a selective set of case studies”.
He also says the paper does not make a comparison with previous estimates for China or to previous systematic reviews prepared by the likes of the International Energy Agency (IEA).
While acknowledging some of these points as valid, Feng says they chose case studies that reflect current Chinese common practices and that they could not retrieve the relevant emissions data from the industry databases Giesekam suggests.
“Overall, it would be different and unrealistic to use international emission data and best practices to represent China’s emission in 2015,” he tells Carbon Brief.
For his part, Pomponi says that while Giesekam’s criticism is valid, he sees things “slightly differently”. He says: “I think it’s impossible that a study incorporates everything that’s out there.”
Giesekam also notes what he sees as some unusual choices in the way the researchers carried out the study, including a lack of detail in both their “bottom-up” and “top down” calculations – for example, giving all steel the same “carbon factor”.
Feng says that while they would “love this study to go deeper” and describes his team’s work in this area as on-going, he notes they used a “simple approach” that involved taking averages of steel and cement data:
“That is why we also employ a top-down method to cross-validate the bottom-up method calculation to make sure the total emission results match with each other.”
To this point, Pomponi tells Carbon Brief it is “inevitable to sacrifice depth for breadth in academic research” and says that, while there are certainly issues with the paper, he thinks it is valuable to see different methods being used to assess embodied carbon:
“It’s really good they used two [approaches] and compared them. They are extremely different methods so it’s good that they seem to point to the same number.”
Construction workers on a residential building site in Huaian city, China. Credit: Imaginechina Limited / Alamy Stock Photo.
Cutting embodied CO2
The researchers say that on a global scale, the relatively limited attention paid to embodied carbon is preventing an accurate assessment of the building sector’s environmental impacts.
Dr Danielle Densley Tingley, an architectural engineer at the University of Sheffield who was not involved in the work, says these emissions are generally not given sufficient attention by nations setting climate targets. She tells Carbon Brief this is partly due to the way they are reported:
“They’re often lumped into ‘industrial emissions’. This focuses on the production of the materials – where there are only small efficiencies left to gain – but doesn’t really look at how the materials are then used, what is driving their consumption etc.”
She says better design and a focus on “deep retrofits” instead of demolition would help cut embodied emissions in buildings. Pomponi agrees that design lies at the heart of this issue:
“At the moment we are inefficient in the sense that we put more material than is actually needed into buildings … Firms tend to go with ‘rules of thumb’ or things that worked in the past rather than starting from scratch.”
Measures have been proposed to cut these emissions in some countries. The World Green Building Council has set a target of 40% less embodied carbon in all new buildings, infrastructure and renovations by 2030.
The authors of the new study estimate that, despite a focus on operational carbon emissions in China, the annual potential for reductions in the building sector could actually be larger for embodied than operational CO2.
Greenpeace East Asia’s Shen says that after years of intensive construction the situation is shifting and, going forward, the Chinese authorities are going to have to be “extremely careful” about what they build:
“The country has entered into a new stage of development in that blindly putting up more infrastructure is not only environmentally unsustainable but also will not keep the same investment return the country yielded in the last decades.”
Zhu, W. et al. (2020) Analysis of the embodied carbon dioxide in the building sector: A case of China, Journal of Cleaner Production, doi.org/10.1016/j.jclepro.2020.122438
Published under a CC license. You are welcome to reproduce unadapted material in full for non-commercial use, credited ‘Carbon Brief’ with a link to the article.
“Individually we are no match for nature. Together we are.“
Stewart Simonsen, Assistant Director-General, World Health Organization; in conversation with Fareed Zakaria, GPS, 24 May 2020
“Congress will have to think with knowledge that we will have another crisis.”
Gary Cohn, Former Director, National Economic Council, Former President & Chief Operating Officer, Goldman Sachs, in conversation with Fareed Zakaria, GPS, 24 May 2020
Given the health, governance, and legal risks posed by the coronavirus and the covid-19 response, a primary issue affecting us all, including galleries, museums, and cultural organizations around the world, has been how to limit its spread. As a prophylactic vaccine has not yet been developed, decisions were made to limit possible exposure and contagion by distancing people from one another. In many countries all organizations and enterprises except those providing what have been considered “essential” services were closed, museums included.
Museums are public spaces that welcome people through their doors into shared spaces to look at art together. They have had to grapple with the questions of whether or not and how to engage their audiences while closed. They grapple now with the question of how best to re-open while continuing to mitigate the risk of contagion and spread.
The learning curve has been steep and rapid. Marc Spiegler, Global Director of Art Basel, and museum leaders from Asia, Europe, and the United States addressed the learning curve and responses of the museum sector during a webinar discussion that took place on 21 May, “How will the pandemic change institutions?“
Dr. Zoé Whitley, director of the Chisenhale Gallery, London, Anne Pasternak, Shelby White and Leon Levy Director of the Brooklyn Museum, New York City, Phlip Tinari, director and CEO of the UCCA Center for Contemporary Art, Beijing, and Dr. András Szántó, author and cultural strategy advisor, New York City, shared their thoughts and perspectives on the missions, priorities, and activities of their organizations, how they were managing during the pandemic and concomitant shut-down, risks, risk management, and ways to make it possible to be back in physical spaces looking at art with other people.
“What roles should institutions play in the post-covid cultural landscape, assuming you can even guess what the landscape is going to be?”
Acknowledging that “we have a responsibility to re-think how we remain relevant to our audiences,” Dr. Whitley asked, “how do you start charting a new path under these incredibly strange circumstances?”
“I think that’s precisely the question,” she continues. “What might rank as the world’s worst hypothetical interview question: how would you lead an organization remotely in the midst of a global pandemic? And you would think it was so absurd as to be not really be able to entertain it. And yet here we are.”
While understanding that the pandemic and the global response caught many off guard, knowing what we now know, we may need to revisit underlying assumptions of absurdity and re-map our thinking. The pathogen and pandemic did not come out of nowhere. See: “Q&A: Could climate change and biodiversity loss raise the risk of pandemics?“.
Pathogens such as the coronavirus that is causing the covid-19 response occur abundantly in nature. As we, through our many behaviors, draw closer to wild animals, for instance, and draw them closer to us, and unless we work consistently and with intention to acknowledge, manage, and mitigate risk, we may expect ever more such pandemics.
The UCCA Center for Contemporary Art in Beijing may serve as a case study. Having closed its doors on 24 January, the UCCA re-opened to the public on 21 May.
Philip Tinari reflected on the disappearance of everyday routine during the closure, the mood of solemnity of everyday existence, the poignancy of being back in physical space looking at art with people, and the freedom to enter into a public space and look at art.
He observed that while “it’s poignant and it’s just wonderful to be back in physical space looking at art with people, … that can only happen because of larger dynamics in the society.”
“The freedom to enter into a public space and look at art,” the freedom to enter the UCCA Center for Contemporary Art, and Beijing’s 798 Art District in which it is located, is afforded by measures taken to control the contagion and spread.
“To even enter into 798, one needs to have one’s temperature taken and one needs to show a kind of virtual pass which is generated by a government app that, you know, tracks your data and proves that you have not been in any high-risk areas for the last 14 days or 21 days, and even, in some cases, synchs to facial-recognition thermometers that are around town. So, there’s a complete panopticon, and we’re the indirect beneficiaries of it.
“And at our door, there’s another temperature check as there is at the entrance of any restaurant or store. And masking here is completely mandatory and universal. And so then it just becomes a question of how to be responsible and keep things disinfected and use our guards to keep people distanced.
“I guess all to say that we’re all kind of working inside the contexts where we find ourselves. And this one, for the draconian nature of certain measures, they paradoxically allow for the freedom to enter into a public space and look at art.”
As risks abound, continue, and even, arguably, increase, it is crucial to plan and conduct business smartly, in a forward-looking manner, clearly articulating desired outcomes, on the one had, and negative externalities, that are increasingly no longer external, on the other.
UCCA has postponed shows that were on the calendar for this year, “many of which involved intense overseas collaborations and were not going to happen as scheduled.” Yet, learning as early as early March that the museum re-opening would take place on 21 May, the first date also of the re-scheduled Beijing Gallery Week-end, Mr. Tinari and the museum curators realized “that there was no way we could get to May 21 and not have something to show everyone.”
“And so I sat in a room with my curators for about a week. And we came up with an exhibition that we titled “Meditations in an Emergency” after the Frank O’Hara anthology which kind of looks at the post-covid world from five different angles. Everything from the disappearance of everyday routine to the relationship between humans and animals to the proliferation of a sort of de-centered polyphonic or contradictory narrative around news and information.
“It’s a 26-artist group show that’s actually, I don’t mean to brag or anything, but it’s really beautifully installed. And it’s poignant and it’s just wonderful to be back in physical space looking at art with people.”
Thinking forward, Mr. Tinari observes “a certain solemnity to just everyday existence now. People are ready to come. And in a way that’s a very not the worst frame of mind with which to enter into an exhibition.”
What he’s been calling “the new intentionality,” engaging in activities “with a very specific purpose and for a limited duration,” applies, he says, to programming as well. “It’s not that we won’t continue to do big international shows but we’ll do them for specific reasons with kind of very measurable goals in more measured ways.”
Works of art. History. Cultural heritage. The market. Galleries. Art fairs. Museums. Private museums. Institutional and private collections. Fiduciary care. Value.
Let’s consider a pressing issue:
How collections are housed, managed, and cared for and the protection of works of art and tangible assets in an age of increasingly erratic weather, increasing sea-level rise, floods, fires, storms, … and pandemics – which in themselves and the response to which can be devastating.
Does one barricade the art behind flood walls and barriers? Insure the works of art? (Insurance is a good idea. Insurance does not, however, mitigate or prevent future damage. Insurance is used to protect the “value” of the art, not the work of art itself. It is used after damage occurs to recover value.)
Can we protect works of art while mitigating possible future damage?
Atmospheric CO2 is a key factor leading towards the storms, floods, and fires that can be so damaging to art and tangible assets. Is it possible to care for our collections while reducing emissions of CO2 into the air?
The Bizot Group of museum directors, or the International Group of Organizers of Large-scale Exhibitions, thinks so.
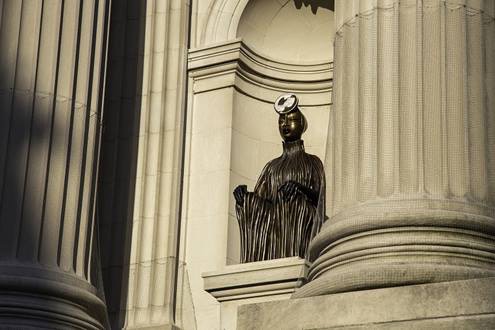
Wangechi Mutu (Kenyan, born Nairobi, 1972), “The Seated II” (bronze, 2019) situated in one of four niches in the facade of New York’s Metropolitan Museum of Art. Courtesy of the the artist, the Metropolitan Museum of Art, and Gladstone Gallery, New York and Brussels.
Axel Rüger, Director of the Van Gogh Museum in Amsterdam from 2006 until June of 2019 when he left the Van Gogh Museum to take up a new appointment as Chief Executive of London’s Royal Academy of Arts, is a member.
The directors agree that museums can reduce the amount of CO2 emissions they are responsible for while recognizing their duty of care to collections:
1. Guiding Principles Museums should review policy and practice, particularly regarding loan requirements, storage and display conditions, and building design and air conditioning systems, with a view to reducing carbon footprints.
Museums need to find ways to reconcile the desirability of long-term preservation of collections with the need to reduce energy use.
Museums should apply whatever methodology or strategies best suit their collections, building and needs, and innovative approaches should be encouraged.
The care of objects is paramount. Subject to this,
environmental standards should become more intelligent and better tailored to specific needs. Blanket conditions should no longer apply. Instead conditions should be determined by the requirements of individual objects or groups of objects and the climate in the part of the world in which the museum is located;
where appropriate, care of collections should be achieved in a way that does not assume air conditioning or other high energy cost solutions. Passive methods, simple technology that is easy to maintain, and lower energy solutions should be considered;
natural and sustainable environmental controls should be explored and exploited fully;
when designing and constructing new buildings or renovating old ones, architects and engineers should be guided significantly to reduce the building’s carbon footprint as a key objective;
the design and build of exhibitions should be managed to mimimise waste and recycle where possible.
2. Guidelines For many classes of object containing hygroscopic material (such as canvas paintings, textiles, ethnographic objects or animal glue) a stable relative humidity (RH) is required in the range of 40 – 60% and a stable temperature in the range 16-25°C with fluctuations of no more than ±10% RH per 24 hours within this range. More sensitive objects will require specific and tighter RH control, depending on the materials, condition, and history of the work of art. A conservators evaluation is essential in establishing the appropriate environmental conditions for works of art requested for loan.
The amount of CO2 being released by human activity each day fell by as much as 17% during the height of the coronavirus crisis in early April, a new study shows.
This means daily emissions temporarily fell to levels last seen in 2006, the study says. In the first four months of the year, it estimates that global emissions from burning fossil fuels and cement production were cut by 1,048m tonnes of CO2 (MtCO2), or 8.6%, compared with 2019 levels.
The research projects a decline of up to 2,729MtCO2 (7.5%) in 2020 as a whole, depending on how the crisis plays out. It is the first to have been through the peer-review process and is broadly in line with an early estimate for China published by Carbon Brief in February, as well as separate global estimates published last month by Carbon Brief and the International Energy Agency.
Today’s study also marks the first-ever attempt to quantify CO2 emissions on a daily basis, for the world and for 69 individual countries, in close to real time. Until now, annual CO2 emissions data has typically been published months or even years later.
A publicly available daily estimate of global or national CO2 emissions would be “incredibly useful, particularly for motivating policy action and pressure”, another researcher tells Carbon Brief.
Coronavirus crisis
The ongoing coronavirus crisis has claimed the lives of hundreds of thousands of people around the world and seen the introduction of severe restrictions on movement in many countries.
These lockdowns have included “stay at home” orders, border closures and other measures that have had direct effects on the use of energy and, consequently, on the release of CO2 emissions.
As the crisis has unfolded, so too have attempts to quantify its impact on CO2 emissions. These efforts have been challenging, however, because real-time CO2 emissions data does not exist.
The annual emissions inventories that countries submit to the UN take years to compile – and even these are estimates rather than direct measurements.
Greenhouse gas emissions are estimated using a variety of methods, often based on “activity data”. This might be the number of miles being driven, the amount of electricity generated or even – in the case of nitrous oxide, which is used as a propellant – via cream consumption.
Today’s study, published in Nature Climate Change, combines activity data for six sectors with a “confinement index” of lockdown measures in each country or region over time.
This allows for an estimate of changes in daily global CO2 emissions in January-April 2020, relative to the 100MtCO2 released on an average day in 2019.
During peak confinement in individual countries, daily CO2 emissions fell by 26% on average, the paper says. However, the size of this effect is reduced at a global level, because not all countries were under the most severe type of lockdown at the same time.
At the peak of the crisis in early April, regions responsible for 89% of daily CO2 emissions were under some form of lockdown, the paper says. Daily global CO2 emissions fell to 83MtCO2 (-17%, with a range of -11 to -25%) on 7 April, equivalent to levels last seen in 2006.
In a press release, lead author Prof Corinne Le Quéré, professor of climate change science at the University of East Anglia’s Tyndall Centre (who will be a panelist at Carbon Brief’s webinar on 21 May), says:
“Population confinement has led to drastic changes in energy use and CO2 emissions. These extreme decreases are likely to be temporary, however, as they do not reflect structural changes in the economic, transport, or energy systems.”
Daily data
In order to estimate daily global CO2 emissions, the researchers use a novel approach that combines sectoral activity data with a country-by-country confinement index.
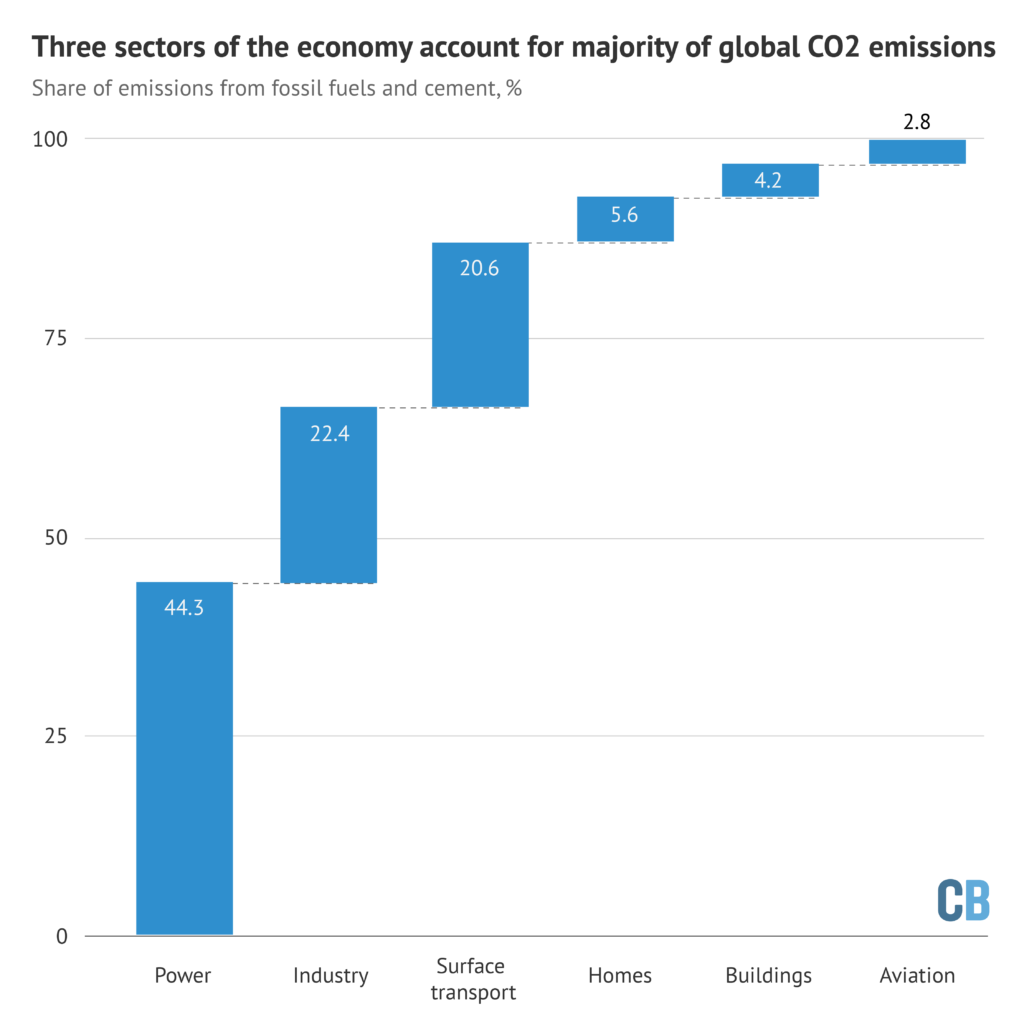
The paper looks at six sectors, shown in the chart below according to their share of global CO2 emissions from fossil fuels and cement. These are electricity and heat (44%); industry (22%); surface transport (20%); homes (6%); public buildings and commerce (4%); and aviation (3%).
Share of global CO2 emissions from fossil fuels and cement due to each of six sectors of the economy. Source: Le Queré et al. (2020). Chart by Carbon Brief.
Notably, this split highlights the limited potential for individual actions to radically reduce global emissions, in contrast to the societal choices that govern CO2 from electricity and industry.
The split in global CO2 emissions, shown above, is then broken down further for each of 69 countries, 50 US states and 30 Chinese provinces, which account for 97% of the global total. This gives industrial CO2 emissions in Italy, for example, on an average day in 2019.
The paper then uses 669 datasets, covering each of these sectors over time, and classified according to the level of confinement in place at each point. For example, this might be daily reports on mobility, traffic and congestion to measure “activity” for surface transport.
This daily data is then adjusted to remove effects unrelated to coronavirus, such as the mild northern hemisphere winter or the day of the week.
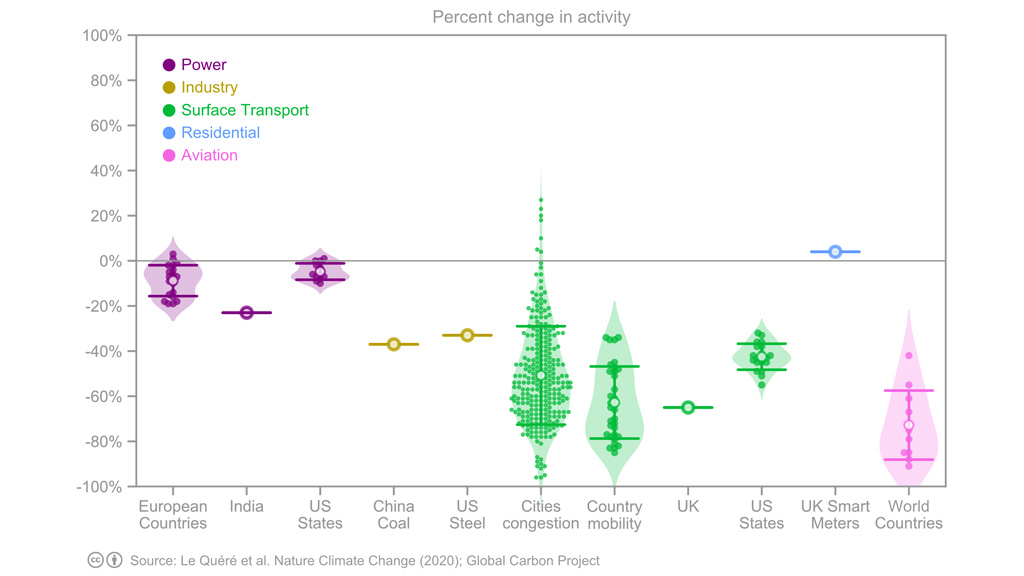
Under the highest level of confinement, surface transport “activity” fell by 50% on average, the paper finds. This is shown in green in the chart, below, where each dot represents a single data point, open circles show the average and the horizontal lines show the variability between datasets. The chart also shows changes in activity for electricity, industry, homes and aviation.
Change in sectoral “activity” under the highest level of coronavirus confinement, percent, relative to an average day in 2019. Each dot represents a single datapoint and open circles show the average. Reading from left to right, the chart shows activity changes in the power sector (purple), industry (yellow), surface transport (green), homes (blue) and aviation (pink). Source: Le Queré et al. (2020).
For electricity, the paper looks at total daily demand in Europe, the US and India, finding an average 15% reduction in demand under strict lockdown. In industry, the paper looks at daily coal use in China reported by Carbon Brief and weekly reports on steel production in the US.
For homes, the paper draws on figures from UK smart meters. And for aviation – the most strongly affected sector – it uses data on domestic and international departures around the world.
As the chart above shows, the analysis relies on relatively sparse information for industry, whereas activity levels in transport draw on a wider range of datasets.
Emissions estimates
The team then uses the average change in activity, for each sector and level of confinement, to build up an estimate of daily CO2 emissions around the world.
For example, on days when Turkey is under the strictest lockdown, the analysis assumes that its power-sector CO2 emissions would fall by 15% compared with the average in 2019 – and those from surface transport by 50%.
When Turkey shifts from “confinement index three”, the strictest controls, down to level two, its power-sector emissions would be 5% below usual levels and transport 40% lower. For each confinement level, the same percentage reductions are assumed to apply to all countries.
This approach means that the team only needed to know when each country, state or province changed its coronavirus lockdown from one “confinement level” to another, as well as the daily average level of CO2 emissions from each sector in 2019.
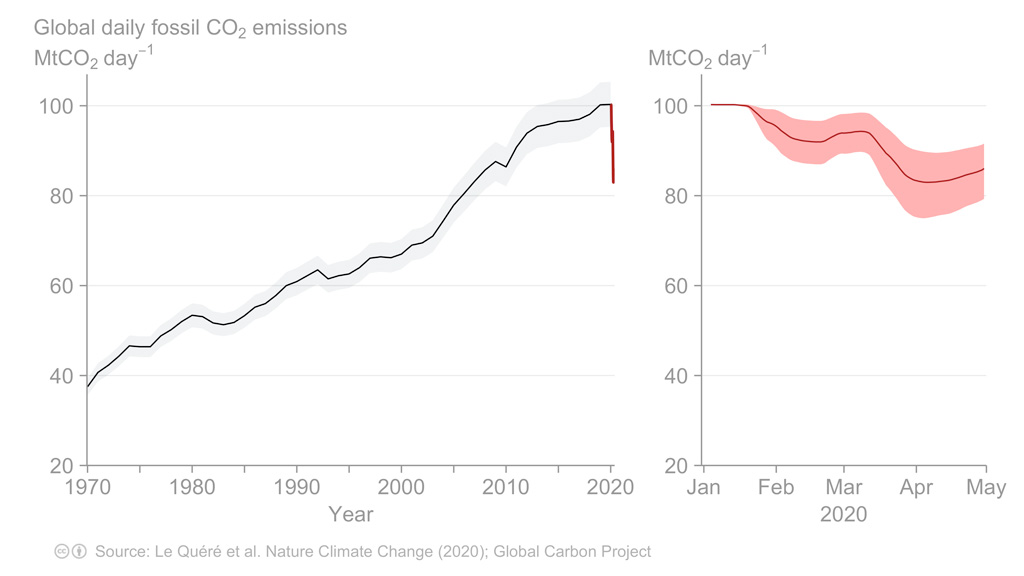
Putting all of these countries and lockdown levels together, the paper finds that the cut in daily global CO2 emissions peaked at -17% on 7 April, shown in the figure, below. Across the first four months of 2020, emissions fell by 1,048MtCO2 (8.6%), compared with 2019 levels.
Estimated daily global CO2 emissions from fossil fuels and cement, million tonnes (MtCO2 per day). The left panel shows emissions from 1970-2020 and the right panel shows the first four months of 2020. Source: Le Queré et al. (2020).
Within this global total, the largest impacts were in China, where emissions fell by an estimated 242MtCO2 in the first four months of the year, followed by the US (-207MtCO2), Europe (-123MtCO2) and India (-98MtCO2).
Dr Glen Peters, research director at Norwegian climate institute Cicero and one of the study authors, tells Carbon Brief that while the approach was designed around the current crisis, the team has gathered the “raw material” to make daily CO2 estimates on an ongoing basis. He says:
“We have discussed more ‘real-time’ estimates for sometime and there are many advantages. We are illustrating one advantage with our paper to see the consequences of particular policy interventions in near real time.”
But Peters notes that some of the daily data they used – the urban congestion index series from satnav maker TomTom, for example – is only being made publicly available during the current crisis and might be made private again in the future. He also asks whether daily data is truly needed, or whether weekly or even monthly estimates might be sufficient for scientists and policymakers.
“I think daily CO2 estimates would be incredibly useful, particularly for motivating policy action and pressure…Climate change already has the classic long-termism problem, but this is exacerbated by the fact that we get a figure on CO2 emissions published once a year, as a marker of how each country is doing.”
If daily CO2 estimates were publicly available for all countries, it would become possible to actively track progress, she says, adding: “You can have a counter on the news, or an app or dashboard on your phone – just like we do with other metrics like stock markets.”
Alternative analyses
Today’s research is not the first to analyse the CO2 impacts of the coronavirus crisis, although it is the first to have completed its passage through peer review.
Another paper, which is currently in review, also attempts to estimate daily global CO2 emissions in close to real time. This work finds the coronavirus crisis cut global emissions by -542MtCO2 below 2019 levels in the first quarter of 2020, similar to the -530MtCO2 figure from today’s paper.
In mid-February, Carbon Brief published an analysis showing that emissions in China were temporarily cut by 200MtCO2 (25%) over a four-week period, during the height of the restrictions. The new study finds that the cut in Chinese emissions peaked at 24%.
Today’s research also includes estimates of the emissions impact in 2020 as a whole, based on three scenarios for the length of lockdowns around the world. These entail CO2 emissions falling by between -4% and -8%, depending on how the crisis plays out. This range is consistent with estimates published in April byCarbon Brief (-6%) and the International Energy Agency (-8%).
Published under a CC license. You are welcome to reproduce unadapted material in full for non-commercial use, credited ‘Carbon Brief’ with a link to the article.
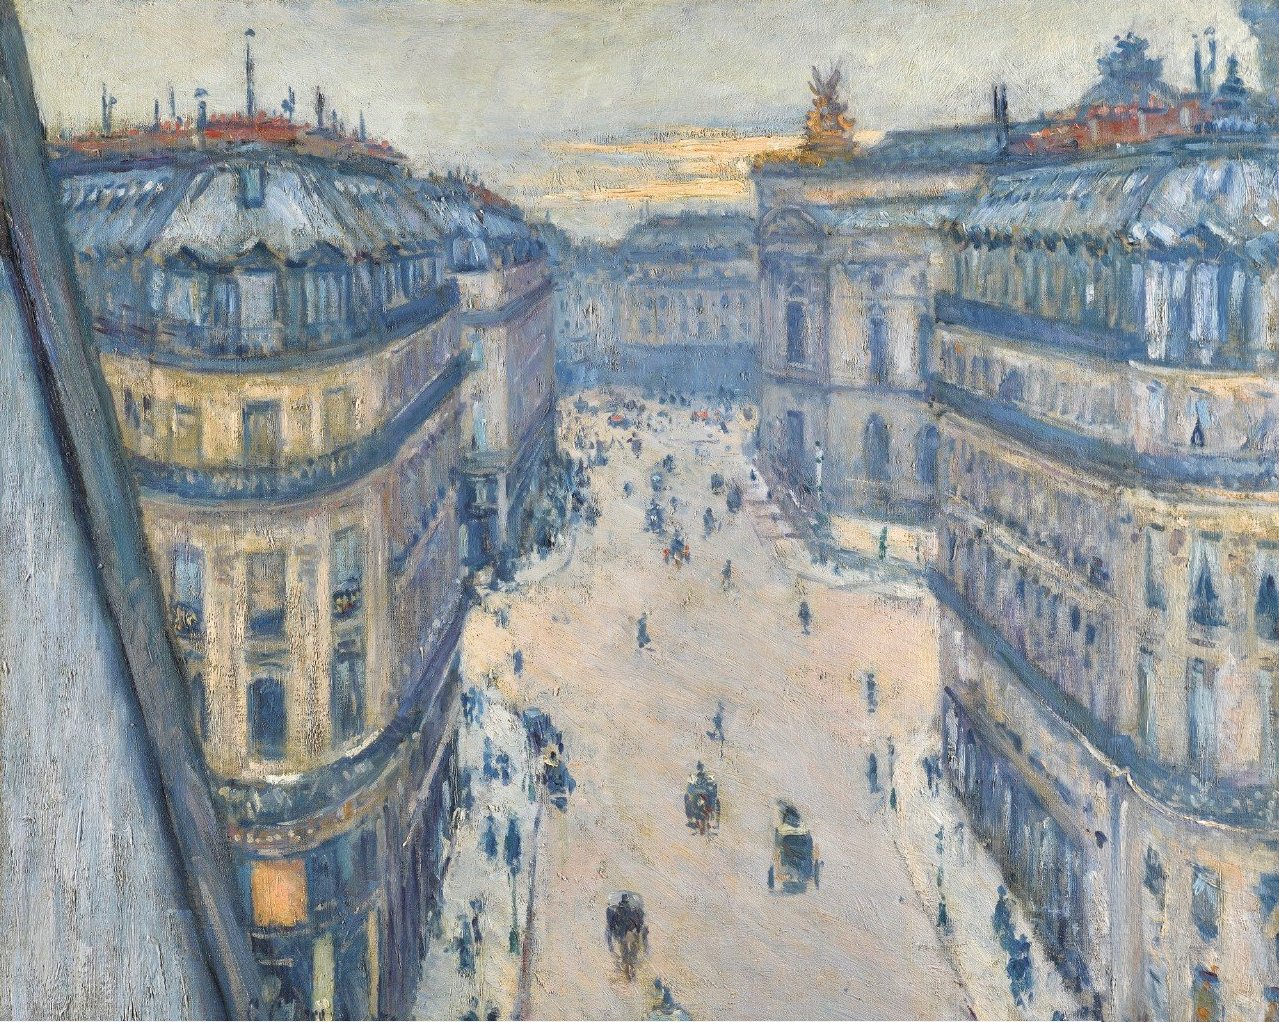
Offered at the Sotheby’s New York Impressionist & Modern Art Evening Sale of 14 May 2019 with an estimate of US $6 – $8 million, Gustave Caillebotte’s “La Rue Halévy, vue du sixième étage” (oil on canvas, 1878) sold for US $13,932,000 (with fees).
Hasso Plattner, co-founder of the German software company SAP, SE, is said by The Canvas to have purchased the painting. Mr. Platter founded the Barberini Museum that opened in Potsdam in 2017. A member of “The Giving Pledge” established by Bill Gates and Warren Buffett, per Forbes magazine he is the 94th richest person in the world.
Gustave Caillebotte, “La Rue Halévy, vue du sixième étage” (oil on canvas, 1878)
Hasso Plattner’s collecting focus is the art both of the Impressionists and of the German Democratic Republic. He is said to be the buyer also of Monet’s “Meules” of 1890. “Meules” remained in the collection of Bertha Honoré Palmer and her family for nearly a century, also selling at Sotheby’s Impressionist & Modern Art Evening Sale of 14 May 2019 for $97 million (hammer) / $110,747,000 (with fees).
Caillebotte (1848 – 1884) exhibited “La Rue Halévy, vue du sixième étage” in the Fourth Impressionist Exhibition of 1879.
Napoleon III had introduced ambitious reforms during the 1860s, charging Georges-Eugène Haussmann with a radical reconfiguration of the then medieval city.
Space was created by razing many parts of Paris, developing a grid of straight roads, avenues, boulevards, and modern apartment buildings with grand balconies and large windows that faced the street, offering views of the boulevards below.
Caillebotte – lawyer and engineer by training as well as artist – explored the modern Paris in his work, adopting viewpoints high above the busy city streets.
The elevated vantage point of “La Rue Halévy, vue du sixième étage” afforded Caillebotte the freedom to view and manipulate perspective, tilting the ground of the picture plane in a manner that has been considered characteristic of his work and one of his greatest contributions in the move towards Modernism.
Gustave Caillebotte, “La Rue Halévy, vue du sixième étage,” Lot 17, Impressionist & Modern Art Evening Sale, 14 May 2019, Sotheby’s New York, Catalogue Note
Powerhouse Telemark, an energy positive (producing more energy than it consumes) 6,500-square-meter (70,000-square-foot), 11-story office building, has been commissioned by real estate developer Emil Eriksrød for the Norwegian town of Porsgrunn.
Eriksrød has commissioned the American-Norwegian architecture and design firm Snøhetta to design the building. Powerhouse Telemark is set to be completed in February of 2019.
“The future is all about thinking big, bold, and long term,” says Snøhetta founding partner Kjetil Trædal Thorson, “and we need someone to pave the way. With its innovative solutions and design, we believe this building will inspire commercial real estate developers worldwide to push the limits of what buildings can accomplish”.
“The world needs a lot of energy-positive buildings,” observes the developer, Emil Eriksrød, CEO of R8 Property. “I hope we will be plagiarized and copied, replicated in all seven continents.”
“This building should do wonders in lowering the bar for daring to do both spectacular and environmentally forward buildings, hopefully in a combination”.
Mark Bradford’s “Constitution IV” (mixed media on canvas, 2013) sold, from the collection of Fredric Brandt, plastic surgeon to the stars, for £3,778,500 at the Phillips London Contemporary Art Evening Sale of 14 October 2015. This sale set an auction record, since exceeded, for the artist.
Mark Bradford, born in Los Angeles, California in 1961, continues to live and work in Los Angeles. He has been exclusively represented by Hauser & Wirth since 2015.
Christopher Bedford, director of the Baltimore Museum of Art, considers Mark Bradford to be “the most important living abstract painter”.
The catalogue prepared by Phillips observes that “Mark Bradford’s vast tactile works characterized by their décollaged surfaces, evoke a sense of transience and instability. In compositions such as ‘Constitution IV’ however, these ideas transcend material objects and infiltrate less physical subjects consequently, indicating the fragility of seemingly solid notions.”
The essay continues, “Using printed text through his collage and décollage technique the canvas becomes a surface offering insights into further meanings and depths … Thus, the viewer is drawn into Bradford’s works in order to try and draw meaning from the myriad of letters flickering in and out of focus.”
Loïc Gouzer, Christie’s Co-Chairman of Post-War and Contemporary Art, has announced that he will be selling the painting “Suprematist Composition” (Kazimir Malevich, oil on canvas, 1916) in May. Estimate: $70 million.
“Suprematist Composition” was last sold at Sotheby’s on 3 November 2008 by the heirs of the artist (after being in the collection of the Stedelijk Museum Amsterdam for several decades). Art dealer David Nahmad purchased the painting for US $60,002,500.
Mr. Gouzer is confident of the art historic, and current market, value of this work. “‘A work like this one should be the corner stone of every major collection or museum and if the market was indexed to the art historical importance of works, then this should be a billion $ painting (although we as specialists have to sadly take into account the laws of gravity and the estimate will be in the region of $70m).'”
Sixth sense matters. “’I relate it a lot to my spearfishing—you don’t know why, but you know that if you dive now the big fish is going to come. When you’re at the surface, you don’t see anything, but you just have this instinct that it is going to happen. In art, it is the same thing—this instinct sometimes that I know a painting is going to move.’”
Company matters too. “’If you start putting works around another work, they give each other meaning. Each of the works are in dialogue, and they help each other.'”