Daily global CO2 emissions ‘cut to 2006 levels’ during height of coronavirus crisis

Daily global CO2 emissions ‘cut to 2006 levels’ during height of coronavirus crisis

Simon Evans, Carbon Brief, 19 May 2020

***

The amount of CO2 being released by human activity each day fell by as much as 17% during the height of the coronavirus crisis in early April, a new study shows.

This means daily emissions temporarily fell to levels last seen in 2006, the study says. In the first four months of the year, it estimates that global emissions from burning fossil fuels and cement production were cut by 1,048m tonnes of CO2 (MtCO2), or 8.6%, compared with 2019 levels.

The research projects a decline of up to 2,729MtCO2 (7.5%) in 2020 as a whole, depending on how the crisis plays out. It is the first to have been through the peer-review process and is broadly in line with an early estimate for China published by Carbon Brief in February, as well as separate global estimates published last month by Carbon Brief and the International Energy Agency.

Today’s study also marks the first-ever attempt to quantify CO2 emissions on a daily basis, for the world and for 69 individual countries, in close to real time. Until now, annual CO2 emissions data has typically been published months or even years later.

A publicly available daily estimate of global or national CO2 emissions would be “incredibly useful, particularly for motivating policy action and pressure”, another researcher tells Carbon Brief.

Coronavirus crisis

The ongoing coronavirus crisis has claimed the lives of hundreds of thousands of people around the world and seen the introduction of severe restrictions on movement in many countries.

These lockdowns have included “stay at home” orders, border closures and other measures that have had direct effects on the use of energy and, consequently, on the release of CO2 emissions.

As the crisis has unfolded, so too have attempts to quantify its impact on CO2 emissions. These efforts have been challenging, however, because real-time CO2 emissions data does not exist.

The annual emissions inventories that countries submit to the UN take years to compile – and even these are estimates rather than direct measurements.

Greenhouse gas emissions are estimated using a variety of methods, often based on “activity data”. This might be the number of miles being driven, the amount of electricity generated or even – in the case of nitrous oxide, which is used as a propellant  – via cream consumption.

Today’s study, published in Nature Climate Change, combines activity data for six sectors with a “confinement index” of lockdown measures in each country or region over time.

This allows for an estimate of changes in daily global CO2 emissions in January-April 2020, relative to the 100MtCO2 released on an average day in 2019.

During peak confinement in individual countries, daily CO2 emissions fell by 26% on average, the paper says. However, the size of this effect is reduced at a global level, because not all countries were under the most severe type of lockdown at the same time.

At the peak of the crisis in early April, regions responsible for 89% of daily CO2 emissions were under some form of lockdown, the paper says. Daily global CO2 emissions fell to 83MtCO2 (-17%, with a range of -11 to -25%) on 7 April, equivalent to levels last seen in 2006.

In a press release, lead author Prof Corinne Le Quéré, professor of climate change science at the University of East Anglia’s Tyndall Centre (who will be a panelist at Carbon Brief’s webinar on 21 May), says:

“Population confinement has led to drastic changes in energy use and CO2 emissions. These extreme decreases are likely to be temporary, however, as they do not reflect structural changes in the economic, transport, or energy systems.”

Daily data

In order to estimate daily global CO2 emissions, the researchers use a novel approach that combines sectoral activity data with a country-by-country confinement index.

The paper looks at six sectors, shown in the chart below according to their share of global CO2 emissions from fossil fuels and cement. These are electricity and heat (44%); industry (22%); surface transport (20%); homes (6%); public buildings and commerce (4%); and aviation (3%).
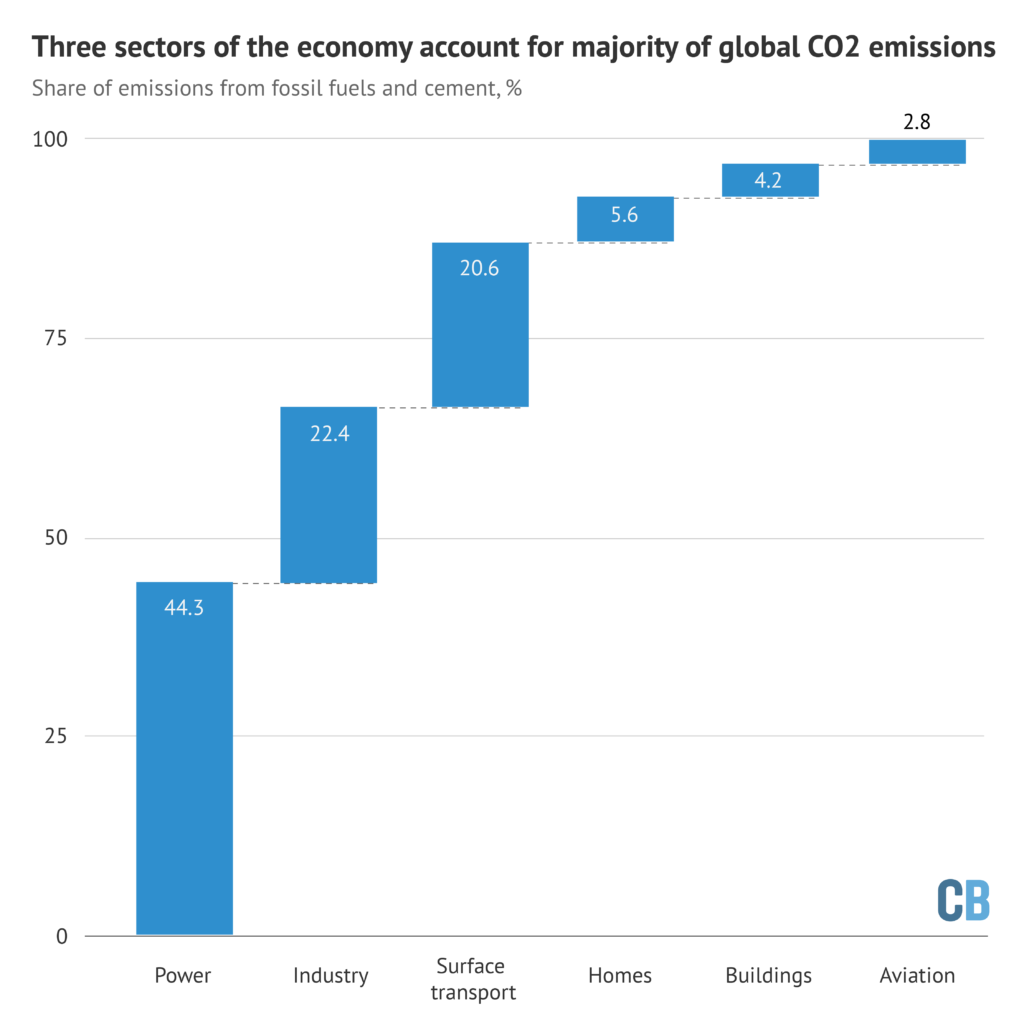
Share of global CO2 emissions from fossil fuels and cement due to each of six sectors of the economy. Source: Le Queré et al. (2020). Chart by Carbon Brief.

Notably, this split highlights the limited potential for individual actions to radically reduce global emissions, in contrast to the societal choices that govern CO2 from electricity and industry.

The split in global CO2 emissions, shown above, is then broken down further for each of 69 countries, 50 US states and 30 Chinese provinces, which account for 97% of the global total. This gives industrial CO2 emissions in Italy, for example, on an average day in 2019.

The paper then uses 669 datasets, covering each of these sectors over time, and classified according to the level of confinement in place at each point. For example, this might be daily reports on mobility, traffic and congestion to measure “activity” for surface transport.

This daily data is then adjusted to remove effects unrelated to coronavirus, such as the mild northern hemisphere winter or the day of the week.

Under the highest level of confinement, surface transport “activity” fell by 50% on average, the paper finds. This is shown in green in the chart, below, where each dot represents a single data point, open circles show the average and the horizontal lines show the variability between datasets. The chart also shows changes in activity for electricity, industry, homes and aviation.
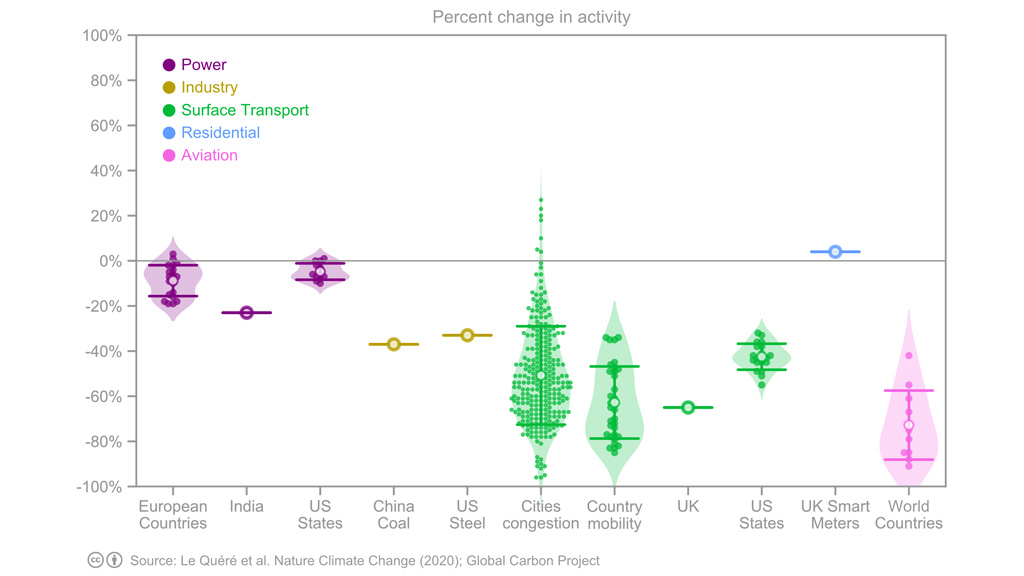
Change in sectoral “activity” under the highest level of coronavirus confinement, percent, relative to an average day in 2019. Each dot represents a single datapoint and open circles show the average. Reading from left to right, the chart shows activity changes in the power sector (purple), industry (yellow), surface transport (green), homes (blue) and aviation (pink). Source: Le Queré et al. (2020).

For electricity, the paper looks at total daily demand in Europe, the US and India, finding an average 15% reduction in demand under strict lockdown. In industry, the paper looks at daily coal use in China reported by Carbon Brief and weekly reports on steel production in the US.

For homes, the paper draws on figures from UK smart meters. And for aviation – the most strongly affected sector – it uses data on domestic and international departures around the world.

As the chart above shows, the analysis relies on relatively sparse information for industry, whereas activity levels in transport draw on a wider range of datasets.

Emissions estimates

The team then uses the average change in activity, for each sector and level of confinement, to build up an estimate of daily CO2 emissions around the world.

For example, on days when Turkey is under the strictest lockdown, the analysis assumes that its power-sector CO2 emissions would fall by 15% compared with the average in 2019 – and those from surface transport by 50%.

When Turkey shifts from “confinement index three”, the strictest controls, down to level two, its power-sector emissions would be 5% below usual levels and transport 40% lower. For each confinement level, the same percentage reductions are assumed to apply to all countries.

This approach means that the team only needed to know when each country, state or province changed its coronavirus lockdown from one “confinement level” to another, as well as the daily average level of CO2 emissions from each sector in 2019.

Putting all of these countries and lockdown levels together, the paper finds that the cut in daily global CO2 emissions peaked at -17% on 7 April, shown in the figure, below. Across the first four months of 2020, emissions fell by 1,048MtCO2 (8.6%), compared with 2019 levels.
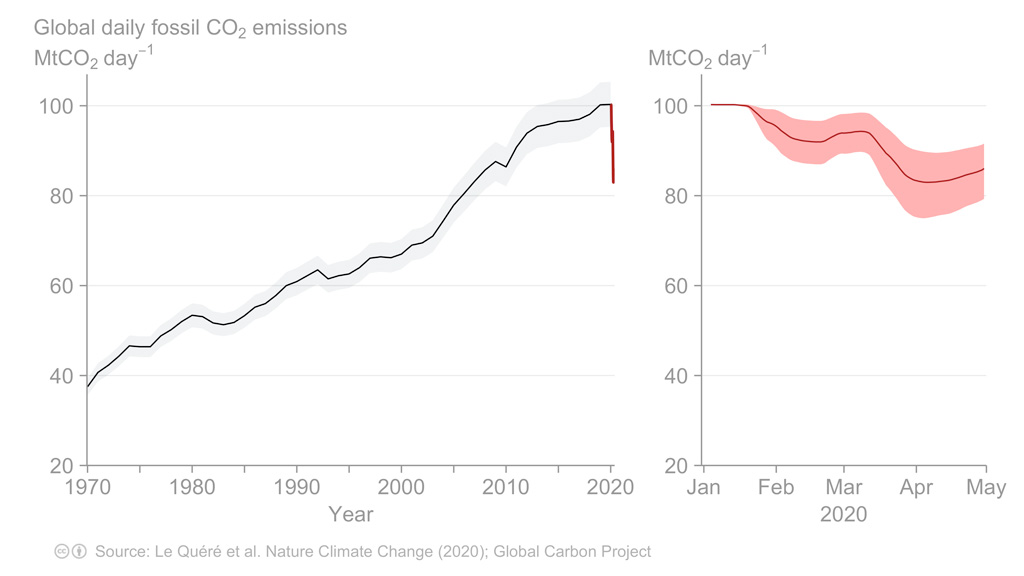
Estimated daily global CO2 emissions from fossil fuels and cement, million tonnes (MtCO2 per day). The left panel shows emissions from 1970-2020 and the right panel shows the first four months of 2020. Source: Le Queré et al. (2020).

Within this global total, the largest impacts were in China, where emissions fell by an estimated 242MtCO2 in the first four months of the year, followed by the US (-207MtCO2), Europe (-123MtCO2) and India (-98MtCO2).

Dr Glen Peters, research director at Norwegian climate institute Cicero and one of the study authors, tells Carbon Brief that while the approach was designed around the current crisis, the team has gathered the “raw material” to make daily CO2 estimates on an ongoing basis. He says:

“We have discussed more ‘real-time’ estimates for sometime and there are many advantages. We are illustrating one advantage with our paper to see the consequences of particular policy interventions in near real time.”

But Peters notes that some of the daily data they used – the urban congestion index series from satnav maker TomTom, for example – is only being made publicly available during the current crisis and might be made private again in the future. He also asks whether daily data is truly needed, or whether weekly or even monthly estimates might be sufficient for scientists and policymakers.

Dr Hannah Ritchie, head of research at website Our World in Data and one of the reviewers of the new study, tells Carbon Brief:

“I think daily CO2 estimates would be incredibly useful, particularly for motivating policy action and pressure…Climate change already has the classic long-termism problem, but this is exacerbated by the fact that we get a figure on CO2 emissions published once a year, as a marker of how each country is doing.”

If daily CO2 estimates were publicly available for all countries, it would become possible to actively track progress, she says, adding: “You can have a counter on the news, or an app or dashboard on your phone – just like we do with other metrics like stock markets.”

Alternative analyses

Today’s research is not the first to analyse the CO2 impacts of the coronavirus crisis, although it is the first to have completed its passage through peer review.

Another paper, which is currently in review, also attempts to estimate daily global CO2 emissions in close to real time. This work finds the coronavirus crisis cut global emissions by -542MtCO2 below 2019 levels in the first quarter of 2020, similar to the -530MtCO2 figure from today’s paper.

In mid-February, Carbon Brief published an analysis showing that emissions in China were temporarily cut by 200MtCO2 (25%) over a four-week period, during the height of the restrictions. The new study finds that the cut in Chinese emissions peaked at 24%.

Today’s research also includes estimates of the emissions impact in 2020 as a whole, based on three scenarios for the length of lockdowns around the world. These entail CO2 emissions falling by between -4% and -8%, depending on how the crisis plays out. This range is consistent with estimates published in April byCarbon Brief (-6%) and the International Energy Agency (-8%).

***

Daily global CO2 emissions ‘cut to 2006 levels’ during height of coronavirus crisis

Simon Evans, Carbon Brief, 19 May 2020

Published under a CC license. You are welcome to reproduce unadapted material in full for non-commercial use, credited ‘Carbon Brief’ with a link to the article. 

“blockage” & the valuation of damage to art for an insurance claim

Ronald D. Spencer, Chairman of the Art Law Practice at the New York law firm of Carter Ledyard & Milburn LLP, addresses the issue of the valuation of loss or damage to art for an insurance claim. He specifically addresses the use of, and questions the appropriateness of the use of, “blockage” and “blockage discounts” as applicable standards for interpreting the loss valuation provisions of an insurance contract.

The insurance coverage amount is the maximum amount the policy will pay. This amount provides the basis for calculation of insurance premiums. Most insurance claims do not involve claims for the full coverage amount.

The methodology used by the insurer to value a damage claim is a relevant variable for the insured. Most art insurance policies are vague, however, on the valuation method, “providing, simply, that in the event of disagreement on the value of the loss, the insured and insurer will each retain their own appraisers, and if the appraisers do not agree on the value of the loss, the dispute is to be submitted to an umpire or arbitrator, whose decision will be final.”

New York’s Bruce Silverstein Gallery suffered loss on October 29, 2012 caused by flooding during Hurricane Sandy. The gallery had an “All Risks Fine Art Dealers Floater” insurance policy with a “Basis of Valuation” provision stipulating that “consigned property shall be valued at the Agreed Net Consigned Value Plus 10%.” The concept of “blockage” was applied by the umpire representing the gallery’s insurance company. This was the first time the concept of “blockage” for art sales, which first arose in 1972 in the context of art valuations for estate tax purposes, was applied to an art valuation for purposes of calculating a loss for an insurance claim.

When valuing the loss of many artworks, the concept of “blockage” values works as they could be sold on one particular date, the date of the disaster (or death, in the framework of estate sales) on which the loss takes place. Blockage discounts the present value of the works of art based on future streams of income from sales over the period of time it would require to sell the art.

The application of blockage is considered to be consistent with USPAP Standard 6 which provides that when a large mass of property is to be valued as of a specific date, the appraiser is required to take into account that the value of the whole may be different from that of the individual parts.

Mr. Spencer observes that “by choosing to apply a blockage discount to an insurance loss valuation, an umpire, in effect, is deciding that the insurance loss should be determined by the price a bulk buyer of the art at the date of loss would be willing to pay.”

He observes, further, that “the art owner should understand that the result of a blockage discount for the owners’ insurance claim is that the more art the owner has lost, the less the insurer will pay per item—the larger the volume of art lost, the greater the blockage discount for each piece.”

See:

Think Your Art Is Adequately Insured? Here Are a Few Insider Strategies to Help Minimize Your Risk” | Ronald D. Spencer, artnet.com, 8 September 2017

#art #artmarket #artcollections #collectors #galleries #insurance #fineartinsurance #blockage #blockagediscount #risk #hurricane #Sandy #Harvey #Irma #NewYork #Houston #MiamiBeach #appraisals #valuations #finance #tangibleassets #contractlaw


Irma, Art, & Hurricane Preparedness in “South Florida’s Gold Coast”

Miami and Miami Beach are home to many significant collections of art.

Art Basel Miami Beach, the largest contemporary art event in North America showing about $3 billion in works, has been situated in Miami Beach since 2002.

Some of the works of art are housed in residences maintained in any of the more than 400 luxury condo towers that have been developed since 2011. Some are kept in single family homes. Of course, works of art are also to be found housed in museums, both public and private, and in cultural centers.

Marion Maneker of Art Market Monitor, writing from the 2017 Global Auction House Summit presented by Invaluable, reports:

“At the Invaluable Auction House Summit in Boston, Thomas Burns from Fortress Fine Art Storage and Simon Hornby of Crozier both addressed the problems with hurricane preparedness in South Florida’s Gold Coast.

“Burns says his teams have been working all week to move their clients art into Fortress’s facility and prepare the building for an unprecedented blow. “Starting Tuesday we were inundated with clients who were completely unprepared,” Burns said. It turns out major works are in place without insurance and the insurance companies have placed a moratorium on new insurance in the area this week.

“Fortress has a program that allows collectors to put their works in storage in June when they leave the area. The big question is how many have had their works moved back to the beach houses so early in the season.

“Hornby pointed to the fact that art insurance carriers were slow to engage these kind of hurricane preparedness programs waiting until this Tuesday to call for logistical support. By then, it was already too late to add capacity amid the jammed traffic and fuel shortages caused by the massive evacuation taking place.”

Meanwhile, workers at the Faena Hotel Miami Beach have been working to fortify the bullet-proof glass that protects Damien Hirst’s life-size, gilded with 24-karat gold sculpture of the skeleton of a mammoth. Entitled “Gone But Not Forgotten” (2014), the sculpture was acquired at auction in 2014 for $15 million by Ukrainian-American Len Blavatnik. “Gone But Not Forgotten” was then installed in the garden of the Faena Hotel Miami Beach ahead of the opening of Faena Forum in 2016. Mr. Blavatnik is owner of Warner Music Group and a partner, with Argentine entrepreneur and developer Alan Faena, in the Faena Forum.

Mr. Hirst explains the sculpture of the mammoth as “an absolute expression of mortality, but I’ve decorated it to the point where it’s become something else, I’ve pitched everything I can against death to create something more hopeful.”

“The mammoth comes from a time and place that we cannot ever fully understand. Despite its scientific reality, it has attained an almost mythical status and I wanted to play with these ideas of legend, history and science by gilding the skeleton and placing it within a monolithic gold tank. It’s such an absolute expression of mortality, but I’ve decorated it to the point where it’s become something else, I’ve pitched everything I can against death to create something more hopeful, it is gone but not forgotten.”

See:

A Miami Transformed by Wealth Braces for the Storm” | Michael Smith and Katya Kazakina, Bloomberg, 8 September 2017

Irma Threatens Art Spread Throughout South Florida Homes” | Marion Maneker, Art Market Monitor, 8 September 2017

Culture’s a carnival for opening of dazzling Faena Forum” | Andres Viglucci, Miami Herald, 25 November 2016

Hirst’s golden mammoth on display at Faena Hotel Miami Beach” | Damien Hirst.com, 8 December 2015

Len Blavatnik buys Damien Hirst work for $15M at amfAR gala” | Emily Smith, Page Six, 23 May 2014

#Miami #MiamiBeach #Irma #HurricaneIrma #preparations #insurance #art #artmarket #artstorage #FortressFineArtStorage #Crozier #ArtBaselMiamiBeach #Faena #FaenaForum #AlanFaena #LenBlavatnik #DamienHirst #GoneButNotForgotten

Miami museums prepare as Hurricane Irma approaches

What a month.

Museums in Miami and Miami Beach are taking precautionary measures ahead of the possible landfall of Hurricane Irma.

Pérez Art Museum Miami (PAMM), The Wolfsonian—Florida International University (Wolfsonian-FIU, www.wolfsonian.org), the Institute of Contemporary Arts Miami (ICA Miami), Dimensions Variable, the Vizcaya Museum and Gardens, and Faena Art closed yesterday (Wednesday) and will remain closed through the weekend.

The Pérez Art Museum Miami was designed and engineered to withstand the vicissitudes of extreme weather.

The ICA Miami’s new building, expected to open to the public in December, is also designed to weather extreme storms. The museum “’collection is currently being held in a state-of-the-art storage facility, which also adheres to hurricane codes’”.

The Bass Museum of Art, currently undergoing expansion and expected to open in October, has an action plan to protect the building, the collection, and employees.

See:

Miami museums hunker down ahead of Hurricane Irma” | Helen Stoilas, The Art Newspaper, 6 September 2017

Pérez Art Museum Built ‘Like Rock of Gibralter’ for Hurricanes” | Rudabeh Shahbazi, CBS Miami, 9 June 2017

Pérez Art Museum” | Knippers Helbig Advanced Engineering

#art #museums #Miami #MiamiBeach #artcollections #resilience #realestate #climatechange #climaterisk #HurricaneIrma #Irma #smartluxury


real estate investment & climate change futures ・ the next dry neighborhood

If there’s anything more complicated than the global forces of thermal expansion, ice sheet melt and ocean circulation that contribute to worldwide sea-level rise, it might be the forces of real estate speculation.

Real estate investment may no longer be just about the next hot neighborhood, it may also now be about the next dry neighborhood.

“‘That’s it, it’s that simple. To be on the beach and to be on the water costs a lot more money, and the cheaper parts of town were furthest from the beach — but it just turns out that the cheapest parts of town farthest from the beach are the highest elevation, and now they’re worth a lot more than they used to be.'”

Jesse M. Keenan, Harvard Graduate School of Design

“‘The real issue is: Are people making real estate decisions based on climate change futures, rather than sort of normal speculation?'” observes Hugh Gladwin, an anthropologist at Florida International University in Miami. Gladwin’s specialty is using geographic information system mapping to understand large, diverse urban settings.

Jesse M. Keenan is a lawyer who teaches climate change adaptation at Harvard University’s Graduate School of Design. Mr. Keenan formerly served as the co-founder and research director of Columbia University’s Center for Urban Real Estate (CURE). His family roots are in Miami and he owns a house and has an office and parking space in Miami. He thinks people are making real estate decisions based on climate change futures.

Using survey data, Mr. Keenan is beginning to see see evidence that middle-income people are leaving Miami Beach and other places with nuisance flooding. Such flooding makes  it difficult to get around at high tides or insure a car.

Mr. Keenan observes, “‘Everybody I know that is a small owner of real estate that isn’t within the billionaire class — average middle-class, upper-middle-class Miamians who have real estate on the beach — is in the process of selling their properties and moving to the mainland.'”

Sea-level rise is exacerbating the effects of coastal flooding in South Florida. A 2016 University of Miami study finds that coastal flooding is accelerating. The coastal flooding is coinciding with an accelerated rate of sea-level rise in South Florida. The average rate of sea-level rise jumped from an increase of 3 millimeters a year before 2006 to an increase of 9 millimeters a year on average after 2006. Over the course of one decade, from 2006 to 2016, that’s about 3.5 inches of sea-level rise.

Sam Purkis, a marine geologist at the University of Miami, observes,

“‘What will happen, more than likely, is that you’ll have one big hurricane, and you’ll get a big inundation into the city. And that will serve to rot out the infrastructure — the sewer lines, the electricity, the telecoms. Everything that’s under the road. That becomes very costly to keep replacing every time this happens.'”

“‘That’s it, it’s that simple,'” says Harvard’s Jesse Keenan.

“‘To be on the beach and to be on the water costs a lot more money, and the cheaper parts of town were furthest from the beach — but it just turns out that the cheapest parts of town farthest from the beach are the highest elevation, and now they’re worth a lot more than they used to be.'”

Local governments are considering  what sea-level rise means for all those mortgage holders who pay taxes.

Coral Gables released an analysis of how it would pay for infrastructure investment in the face of a shrinking tax base if people leave.

“We’re concerned about it, we’re planning for it, we’re spending money on vulnerability studies trying to know what our vulnerabilities are in terms of our essential infrastructure, and planning to build up and save our communities as long as we can,” Jim Cason, Mayor of Coral Gables, said.

See:

High Ground Is Becoming Hot Property As Sea Level Rises” | Erika Bolstad, ClimateWire, 1 May 2017, re-printed from ClimateWire by Scientific American with permission from E&E News

Hugh Gladwin, Steven J. Green School of International & Public Affairs, Florida International University

Jesse M. Keenan, Harvard University Graduate School of Design

Center for Urban Real Estate, Columbia University GSAPP

Sam Purkis, Professor & Chair, Department of Marine Geosciences, Rosenstiel School of Marine & Atmospheric Science, University of Miami

#realestate #realestatedevelopment #realestatespeculation #art  #ArtBaselMiamiBeach #Miami #MiamiBeach #climatechange #sealevelrise #resilience #Harvard #Columbia #FloridaInternationalUniversity #UniversityofMiami